8.3 What Makes a Map?
The purpose of a map is not limited to navigation. Maps are used in the geosciences to show data or information in a spatial context. Maps are used to convey information about where observations were recorded in the field, or to show a geologist’s interpretations of the materials exposed or deposited on the Earth’s surface. Geologists often use topographic maps as a base on which to display the geological information or data they wish to share. A topographic map is a graphic two-dimensional representation of the three-dimensional surface of the Earth. The features shown on a topographic map may be divided into three groups:
- Relief – hills, valleys, mountains, and plains
- Water features – lakes, ponds, rivers, canals, swamps, and streams
- Cultural features – roads, railways, buildings, and land boundaries
You were introduced to some important concepts about maps in the Google Earth Tutorial and Lab 1 Exercises. You learned that all maps are drawn to scale; that is, a designated distance on the map is equal to a corresponding real distance on the actual surface of the Earth. You also learned that locations on maps are specified using grid systems that might include the geographic or UTM systems. This lab will build upon those concepts to give you a deeper understanding of what elements make a map and what information you can convey in a map.
Map scale
Map scale refers to the fixed ratio between the distance you measure on a map (or in satellite imagery or air photos) and the actual distance on the ground, in the real world. You were introduced to the concept of scale at the beginning of the term, when you completed the Google Earth Tutorial and Lab 1 Exercises. In that tutorial, you used a scale bar to understand distances in Google Earth. Scale bars, also called graphic scale, are one way to represent scale on a map. Graphic scales are used to quickly determine the distance between two points on the map, by comparing the length you measure on the map with your ruler to the scale bar. In Figure 8.3.1 below, each of the long bars on the scale is 2 cm long and represents a distance of 1 km on the ground. Let’s say you measured the distance between two points on a map to be 5 cm. By comparing that length to the scale bar, you can see that 5 cm on the map represents 2.5 km on the ground. Note that the scale bar may be distorted by your screen if you are reading this on an e-reader, smartphone or computer depending on your display settings.

Another way to represent map scale is using a representative fraction (R.F.). The representative fraction is a ratio written in numbers on a map. Two of the common scales for topographic maps in Canada are 1:250,000 and 1:50,000. A R.F. of 1:250,000 means that 1 unit of measurement on the map represents 250,000 of the same unit of measurement on the ground. You can use any unit of measurement (centimetres, inches) as long as you are consistent! A map with a scale of 1:250,000 means that 1 cm on the map is equal to 250,000 cm on the ground, and that 1 inch on the map is equal to 250,000 inches on the ground.
Practice Exercise 8.2
What R.F. is shown by the scale bar drawn above? Assume that each of the long bars on the scale bar is 2 cm in length. Hint: you will have to do some unit conversions!
See Appendix 2 for Practice Exercise 8.2answers.
Determining the scale of an air photo or satellite image
In some cases, you may want to create a map using a base image rather than a base map. Base images could include air photos, captured by a low-flying aircraft along a set flight path, or satellite imagery like the images available in Google Earth Pro. While images can provide valuable details not captured on a topographic map, they typically lack scale. You can calculate the scale of your base image by comparing the length of a distinctive feature in the base image and a topographic map using a simple formula:![]()
National Topographic System (NTS)
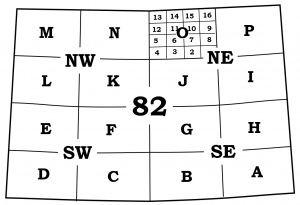
Standard topographic maps, published by the provincial and federal governments, are usually bounded and divided by parallels of latitude and meridians of longitude. In Canada, topographic maps are subdivided into numerous sections and subsections for the purpose of indexing all of the topographic maps of the nation in the National Topographic System (NTS). All topographic maps have a National Topographic Index Number that indicates the scale of the map and helps catalogue all the NTS maps of Canada. For example, the 1:1,000,000 NTS map sheet 82 covers most of southern Alberta, and is divided into indexed subsections as shown in Figure 8.3.2. The relationship between map scale and index number is outlined in table below.
| Map index number | Map scale |
| 82 | 1 : 1,000,000 |
| 82 NE | 1 : 500,000 |
| 82 O | 1 : 250,000 |
| 82 O/1 | 1 : 50,000 |
You should always begin the study of a map by observing the title which gives clues to the location of the map in its wider setting. For your reference, the 1:50,000 scale topographic map that covers the city of Calgary is located on NTS map sheet 82 O/1.

Three-dimensional relief on a two-dimensional map
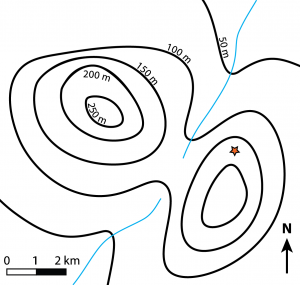
Relief on a topographic map is illustrated using contour lines. These are imaginary lines drawn on a map to join points of equal elevation. Every point on a contour line is at the same elevation. Elevation is measured from a predetermined datum line: mean sea level, which is assigned an elevation of 0. Contour lines separate points of higher elevation (uphill) from points of lower elevation (downhill), therefore points between two contour lines are no lower than the contour line below and no higher than the contour line above. Contour lines never intersect or cross, except in very rare cases of overhanging cliffs. Contour lines always close; this closure may take place outside the map area as shown for the 50 m contour line in Figure 8.3.3. The contour interval (C.I) of a map is the difference in elevation between two adjacent topographic contour lines. The space between adjacent contour lines on a map reflects how steep or gentle the slope is: the closer the contour lines, the steeper the slope. Evenly spaced contour lines represent a uniform slope.
Practice Exercises 8.3
Examine the example topographic map in Figure 8.3.3. The map shows two hills separated by a small valley that has two streams.
- Which hill is the tallest? Or, in other words, which hill has the highest elevation?
- What is the approximate elevation of the red star?
- Toward which direction is each stream flowing?
- Can you see anywhere on the map where topography would be relatively steep?
- Can you see anywhere on the map where topography would be relatively gentle or flat?
- How can you tell the difference between areas with steep versus gentle topography using the contour lines?
- Notice that the 50 m and 100 m contour lines forms a “V” shape as they cross the stream. Topographic contour lines always form a “V” shape as they cross a stream, and the point of the “V” always points upstream. Imagine there is a third stream that originates at the red star and flows toward the NE. Draw in this third stream and using dashed lines, modify the contour lines where they cross this stream.

See Appendix 2 for Practice Exercise 8.3 answers.
Media Attributions
- Figures 8.3.1, 8.3.2, 8.3.3: © Siobhan McGoldrick. CC BY.
A system used to divide the Earth's surface into squares using two sets of perpendicular lines for the purpose of specifying locations and navigation.
A grid system used to specify locations on Earth using coordinates of latitude and longitude.
A grid system used to specify locations on Earth's surface using easting and northing coordinates measured in metres.
graphic or visual representation of the scale of a map
A fixed ratio (e.g., 1:50,000) between linear measurements on the map and the corresponding distances on the ground. An R.F. of 1:50,000 implies that 1 cm on the map represents 50,000 cm on the ground.
Imaginary lines that run east-west and are used to measure latitude in the geographic grid system.
Imaginary lines that run north-south and are used to measure longitude in the geographic grid system.
The system used by Natural Resources Canada for providing general purpose topographic maps of the country.
the amount of variation in elevation and slope in an area
imaginary lines on Earth's surface that connect points of equal elevation
an assumed surface used as a reference for the measurement of elevations and depths
the difference in elevation between two adjacent topographic contour lines

