
Chapter 7: Pulmonary Function; Gas Exchange Between the Environment and Blood
Glen E. Foster; Michael S. Koehle; Anne Lasinsky; and A. William Sheel
Learning Objectives
After reading this chapter, you should be able to:
- Describe the oxygen cascade; the physiological processes by which oxygen moves from room air to blood and what pulmonary adjustments must occur during dynamic exercise for this to occur in an effective manner.
- Identify the main components of the ventilatory control system during exercise.
- Visualize the processes of ventilation and perfusion in humans at rest and during exercise.
- Discuss the linkage between muscle metabolism and the pulmonary response to exercise.
- Describe how the cardiovascular and pulmonary systems interact during exercise.
- Explain what pulmonary limitations are present in some highly trained endurance athletes and how this can affect exercise performance.
Key Terms and Abbreviations
Pulmonary ventilation, pulmonary diffusion, inspiration, expiration, mixed venous oxygen content (CvO2), oxygen uptake (V̇O2), carbon dioxide production (V̇CO2), mixed venous partial pressure of carbon dioxide (PvCO2), cardiac output, alveolar ventilation (V̇A), upper airway, conducting zone, transitional zone, respiratory zone, anatomic dead space, pleural pressure, Fick’s law of diffusion, hemoglobin (Hb), eupnea, tidal volume, ventilation, progressive exercise, minute ventilation (V̇E), maximal oxygen uptake (V̇O2max), vital capacity, total lung capacity (TLC), residual volume (RV), forced vital capacity (FVC), homeostasis, central controller, sensory input, effectors, pontine respiratory group (PRG), dorsal respiratory group (DRG), ventral respiratory group (VRG), rostral ventral respiratory group (rVRG), caudal ventral respiratory group (cVRG), retrotrapezoid nucleus (RTN), Bötzinger complex, preBötzinger complex, chemoreceptors, metaboreceptors, mechanoreceptors, exercise hyperventilation, central locomotor command hypothesis, CO2 flow hypothesis, locomotor muscle mechanoreceptor/metaboreceptor hypothesis, metabolic equivalent (MET), respiratory quotient (RQ), respiratory exchange ratio (RER), Bohr effect, shunt, physiologic dead space, ventilation-perfusion ratio, Fick’s law, aenemia, polycythaemia, erythropoietin (EPO), mechanical interactions, preload, afterload, venous return, ventilatory sinus arrhythmia, metaboreflex, fatigue.
Case Presentation
Chris was born in Edmonton but moved to Victoria 5 years ago to train year round for cycling. He belongs to a team and has sponsorship from one of the large bike companies. With this income he is able to treat training like a full-time job; he does not have to hold a job to support himself. His coach has him doing one or even two workouts most days of the week. He has medaled in national and international road races and has set his sights on one of the large international, multi-day stage races. As part of his training his coach has enlisted Chris in an exercise physiology research study. During one day of the study Chris performs an incremental cycle exercise test to exhaustion to determine his maximal oxygen uptake (V̇O2max) On another day Chris performed a constant load (85% of maximum) cycle test to exhaustion as a lab-based indicator of exercise performance. During the tests the researchers take arterial blood to examine how well Chris is able to transfer oxygen from room air to blood. At rest, Chris’ oxyhemoglobin saturation (SaO2) is 97%, whereas at maximal exercise it is 90%. In healthy individuals, SaO2 is maintained at near-resting values but Chris, like some other highly-trained endurance athletes exhibit a fall in arterial oxygenation. The researchers are also interested if the main muscle of breathing, the diaphragm, can become fatigued during strenuous exercise. Both a reduction in blood oxygen content and diaphragm fatigue have measurable negative effects on exercise performance and emphasize that no organ system (the pulmonary system in this case) is without physiological limits. For further details on this, please see the now-classic work of Dr. Jerome Dempsey titled “Is the Lung Built for Exercise” (Dempsey JA 1986).
Introducing The Pulmonary System
The first major system involved in the oxygen transfer chain is the pulmonary system. It functions to move fresh air, rich in oxygen, from the external environment deep into the alveoli where oxygen diffuses into the blood stream. Carbon dioxide, which has been produced by the body’s tissues, is also removed from the blood-stream and expired into the external environment. These two processes are referred to as pulmonary ventilation and pulmonary diffusion. Pulmonary ventilation specifically is the process of moving air into (inspiration) and out of the lung (expiration). Pulmonary diffusion is the oxygen and carbon dioxide gas exchange that occurs between the blood contained within the pulmonary capillaries and the air within the lungs. The respiratory system is well designed to face several major challenges to pulmonary diffusion that are present during exercise. These challenges include:
Decreased time for gas diffusion: Increases in muscle metabolism with exercise stress alveolar-to-arterial gas exchange. For example, at maximal exercise intensities, oxygen content of venous blood (CvO2) falls below resting levels (about a 20% reduction) due to increased oxygen uptake (V̇O2) while increases in muscle carbon dioxide production (V̇CO2) increase the mixed venous partial pressure of carbon dioxide by as much as 40 mmHg. An increase in cardiac output (Q̇) helps to deliver more oxygen to the working muscles but also dramatically reduces the time for gas exchange to occur in the pulmonary capillaries.
Maintenance of alveolar gas quality: In order to maintain the quality of alveolar oxygen and carbon dioxide partial pressure (Pao2 & Paco2), pulmonary ventilation, or more specifically, alveolar ventilation (V̇A) must increase by as much as 20 times its resting level at maximal exercise intensities. Such an accomplishment requires significant force generating capabilities by the respiratory musculatures. However, the work of breathing must be restrained so as to conserve oxygen for the exercising muscles.
Ability to meet ventilatory muscle blood flow requirements: Like locomotor muscles, the respiratory muscles’ demand for oxygen metabolism increases with increasing exercise intensity. In order to meet these demands, blood flow to the muscles that perform ventilation must increase. However, the increased blood supply to the respiratory muscles must be controlled effectively so as to not compromise the flow of blood to the exercising muscles.
Ability to match ventilation ventilation and metabolic demand: Ventilation during exercise must increase in a manner proportional to increasing whole body metabolism. If this did not occur arterial blood gas and pH would quickly deteriorate, dramatically affecting exercise performance. A complex respiratory control system composed of sensors throughout the cardiovascular, pulmonary, and skeletal muscle systems is capable of notifying a central pattern generator which integrates the mechanical and metabolic information and produces an appropriate motor output to the respiratory muscles.
The purpose of this chapter is to address several important physiological principles as they pertain to the pulmonary system of a healthy, young adult exercising at sea level. This includes description of the anatomical components of the respiratory system, the pattern of breathing during steady-state and progressive exercise, lung mechanics and energetics of respiratory muscle contraction, control of exercise ventilation, pulmonary gas exchange, and cardiopulmonary interactions. Finally, the chapter will conclude with a discussion of pulmonary-related constraints to athletic performance in elite athletes.
The study of the pulmonary physiology of exercise has a number of abbreviations. Many of the more commonly used terms are presented in Table 7-1.
|
Abbreviation |
Term |
Typical Units |
|---|---|---|
|
VT |
Tidal Volume |
L or mL |
|
b |
Breathing Frequency |
breaths·min-1 |
|
V˙ e |
Minute Ventilation |
L·min-1 |
|
V˙ a |
Alveolar Ventilation |
L·min-1 |
|
VD |
Dead Space |
L or mL |
|
VD/VT |
Ratio of Physiologic Dead Space to Tidal Volume |
Unit-less |
|
Pao2 |
Arterial Partial Pressure of Oxygen |
mmHg |
|
Paco2 |
Arterial Partial Pressure of Carbon Dioxide |
mmHg |
|
Pao2 |
Alveolar Partial Pressure of Oxygen |
mmHg |
|
Paco2 |
Alveolar Partial Pressure of Carbon Dioxide |
mmHg |
|
Sao2 |
Oxyhemoglobin Saturation |
% |
|
AaDo2 |
Alveolar-arterial Oxygen Difference |
mmHg |
|
Cao2 |
Arterial Oxygen Content |
mL O2·100mL-1 |
|
V˙ o2 |
Oxygen Consumption |
L·min-1 or ml·kg-1·min-1 |
|
V˙ co2 |
Carbon Dioxide Production |
L·min-1 |
|
RER |
Respiratory Exchange Ratio (V˙ co2/V˙ o2) |
Unit-less |
Pulmonary System Anatomy
The pulmonary (respiratory) system is composed of the airways, the blood gas interface, the blood vessels, and the respiratory muscles (see Figure 7-1). In this section, the anatomical components of the respiratory system will be described in detail with reference to their function.
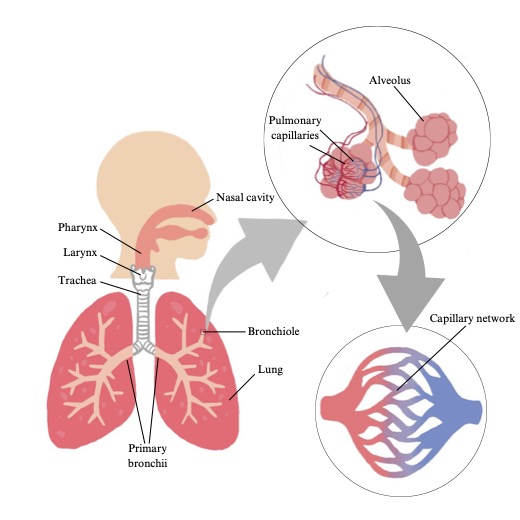
Airways
The airways are the conducting ‘pipes’ through which the air flows, to reach the blood gas interface where pulmonary diffusion takes place. The first airways encountered are those of the upper airway. The upper airway consists of the nose, mouth, pharynx, and larynx. The nose is responsible for humidifying and warming the inspired air and is also a primary site of airflow resistance. The mouth can also be used for breathing and is involved in phonation and mastication. Both the mouth and the nose are connected into a single airway by the pharynx. Finally, the larynx contains the vocal cords and is therefore also responsible for phonation.
From the upper airways, the airways further divide like a branching tree, hanging upside down. From a single trunk, called the trachea, the airways branch into two main bronchi (one to each lung) and then each bronchus progressively branches, narrows, ending in short bronchioles and then terminal bronchioles. There are approximately 16 generations of branching that take place from the trachea to the terminal bronchioles and this accounts for the conducting zone. The conducting zone is composed of airways that are not involved in gas exchange and are simply responsible for the movement of air from the external environment to the transitional and respiratory zones. The volume of air found within the conducting zone is referred to as the dead space. Anatomic dead space refers to the conducting airways which contain no alveoli and do not participate in gas exchange. The volume of air in the dead space is approximately 150 ml at rest. However, the volume of the dead space increases during exercise, due to distention of the airways, increasing lung volume, and resulting negative pleural pressure. The transitional and respiratory zones. are composed of the respiratory bronchioles, the alveolar ducts, and the alveolar sacs. The transitional and respiratory zones. account for the next 7 generations of airway branching and these represent the main site for gas exchange. The volume of the transitional and respiratory zone is roughly between 2.5 and 3 litres in a resting adult.
The total cross sectional area of the lung increases exponentially from the first to the last generation. The cross sectional area of the trachea at functional residual capacity ranges from 2.0 to 4.7 cm2 (Dolyniuk and Fahey 1986), while airways within the respiratory zone range in cumulative cross-section from 200 to 1000 cm2. Because of this feature (increasing cumulative cross-section) the velocity of gas flow is extremely slow in the vicinity of the alveoli thereby assisting with gas exchange. This is like a fast-flowing river slowing down as the width of the river increases.
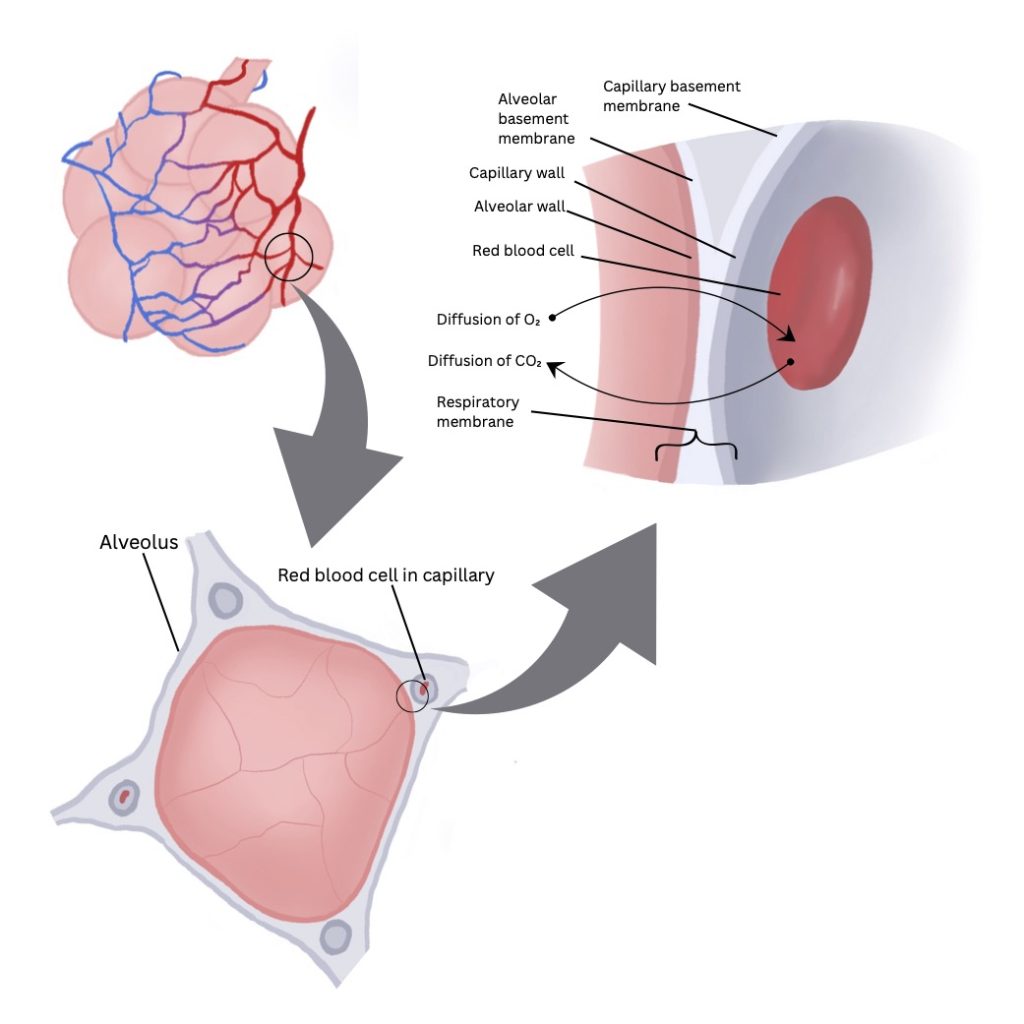
Blood Gas Interface
The blood gas interface consists of the alveolar epithelium and the endothelial lining of the pulmonary capillary (see Figure 7-2). Important features of the blood gas interface include its extensive surface area (850 – 1000 cm2) and its thinness (0.3 µm). These features are ideal for the diffusion of oxygen and carbon dioxide between the air and blood, which is governed by Fick’s law of diffusion. It states that the amount of gas moving across a sheet of tissue is proportional to its surface area and inversely proportional to its thickness.
Oxygen in the air that is inhaled into the alveoli diffuses into the pulmonary capillary blood stream by crossing the alveolar epithelium, the interstitial space, the pulmonary capillary endothelium and the plasma, through the membrane and into the red blood cell. Oxygen then binds to haemoglobin, a protein found in the red blood cells. Carbon dioxide diffuses from the red blood cell or the plasma itself, across the pulmonary capillary endothelium, the interstitium, and finally the alveolar epithelium into the alveoli to be exhaled from the body.
Blood Vessels
The pulmonary blood vessels form a branching network that initially follows alongside the branching airways. Both vessels and airways bifurcate often, becoming smaller with each split. These arterioles and airways go deep within each lobe of the lung. Further downstream, a network of dense capillaries form in the region of the alveolar walls. The pulmonary veins, which return oxygenated blood to the left side of the heart, travel between the lobes of the lungs (rather than through their centres).
The pulmonary capillaries are sufficiently small in diameter (~10µm), just large enough to permit the passage of a red blood cell. This feature improves pulmonary gas exchange by reducing the distance for oxygen and carbon dioxide diffusion. Another important feature involves the vast network of the capillaries themselves, which forms nearly a complete sheet of blood in the vicinity of the alveoli. This large surface area is responsible for an amazingly small resistance to blood flow. Blood flow through each pulmonary capillary at rest is so slow that a red blood cell spends nearly 0.75 seconds in the capillary and traverses several alveoli, each with a diameter of roughly 200 µm.
These important features of the pulmonary circulation are responsible for nearly a complete equilibration of oxygen and carbon dioxide between the alveolar gas and the capillary blood. However, the thin and intricate array of the pulmonary capillaries also makes them quite weak and susceptible to damage. The entire cardiac output must travel through the pulmonary circulation. Since the cardiac output can increase above resting levels by 5 to 6 times with high-intensity exercise, the high rate of flow and pressure in addition to mechanical strain caused by increased lung volumes can be responsible for capillary stress failure. In such an instance plasma and red blood cells may enter the interstitial space or alveoli and impair pulmonary gas exchange.
In addition to the pulmonary circulation, the respiratory system also has a bronchial circulation which is responsible for delivering oxygenated blood to the airways of the conducting zone. This includes supplying blood to the primary, secondary, and lobular bronchi, and the bronchioles.
Ventilatory Muscles & Muscles of the Upper Airway
The ventilatory muscles can be categorized into three different groups. These are the muscles of the upper airway and the bronchi, inspiratory muscles, and expiratory muscles.
The muscles of the upper airway include: nasal dilator muscles, tensor muscles of the soft palate, the genioglossus, and the geniohyoid. These muscles are involved in dilating and stiffening the upper airway thereby preventing its collapse as more negative intrathoracic pressures develop during inspiration. The activity of these muscles is phasic in nature and closely related to ventilation during regular breathing or eupnea. Although the activity of upper airway muscles is not well understood during exercise, there does appear to be some relation between their activity and the magnitude of inspiratory airflow. In addition to the muscles of the upper airway, the smooth muscle of the bronchi are also involved in controlling airway resistance.
Several muscles are involved in the process of inspiration. Airflow into the lungs requires that the volume of the thoracic cavity increase thereby reducing intrathoracic pressure. The pressure gradient generated between the airways and the external environment is responsible for the mass flow of fresh air into the alveoli. Expansion of the thoracic cavity is achieved by activity in the inspiratory muscles. This includes the external intercostals (which expand the rib cage), the diaphragm, the scalene muscles, and finally the sternocleidomastoids.
At rest, elastic recoil of the lung is responsible for the process of expiration. However, during exercise, as breathing frequency and tidal volumes increase, the accessory muscles of expiration are recruited. These muscles include the rectus abdominis, the internal and external oblique muscles, the transversus abdominis, and the internal intercostals. Contraction of the abdominal muscles helps to force the diaphragm upward thereby reducing the volume of the thoracic cavity. Activity in the internal intercostals draws each individual rib together and as a result decreases the volume of the thoracic cavity. A decrease in the volume of the thoracic cavity increases intrathoracic pressure and creates the pressure gradient necessary to expel air from the lungs.
Breathing Patterns During Exercise
Breathing at rest and during exercise is more complicated than simply ventilating the lung. Ventilation must be controlled appropriately such that the work of breathing is minimized and alveolar gas partial pressures are maintained. The control of breathing system is involved in maintaining appropriate breathing patterns and is described below. Variables involved in characterizing the breathing pattern include: end-inspiratory and end-expiratory lung volumes [the difference of which is the tidal volume (VT)], inspiratory and expiratory flow rates, and breath timing [which includes inspired time (TI), expired time (TE), and the frequency of breathing (fb)], and duty cycle [Ti/(Ti+TE)]. The simplest method of assessing breathing patterns during exercise is therefore to measure fb and VT. Other approaches include measuring flow volume loops as discussed below. In this section, the basic characteristics of the breathing pattern during progressive exercise and during sub maximal exercise will be described.
Breathing Patterns During Progressive Exercise
Progressive exercise involves continuously increasing work of the locomotor muscles, such as a ramp protocol maximal exercise test. Other examples include a cycle exercise test with increasing resistance and a treadmill test with increasing speed and/or incline. Figure 7-3 illustrates the ventilatory response during incremental exercise. During this type of exercise, minute ventilation (V̇E) increases with increasing intensity/(V̇O2). At mild exercise intensities, the rise in V̇E is accomplished by increasing both fb and VT (see Figure 7-4). This is in contrast to moderate intensity exercise during which increases in V̇E are achieved primarily by increasing VT while maintaining fb. Increases in VT are accomplished by increasing end-inspiratory lung volume and by decreasing end-expiratory lung volume. This is an ideal ventilatory exercise response because it increases V̇A and decreases dead space ventilation; it therefore has a positive effect on the quality of alveolar gases. During heavier exercise, further increases to VT become too costly with respect to the work of breathing, therefore, VT plateaus and increases in fb are responsible for further increases in . At maximal exercise intensity, VT typically reaches about 50-60% of vital capacity.


Breathing Patterns During Submaximal Exercise
Submaximal exercise is typically an intensity of exercise that can be maintained in excess of five minutes. It may involve a steady state V̇E phase if the intensity is less than 70% of V̇O2max (in an untrained individual). Above this intensity V̇E may not reach a steady state but instead gradually increases.
V̇E during submaximal exercise can be characterized by three phases as illustrated in Figure 7-5. At exercise onset, V̇E increases abruptly and is referred to as phase I. Throughout the first 2-3 minutes of exercise V̇E slowly and gradually increases to a steady state. This slow, gradual increase in V̇E is called phase II. Finally, phase III is the steady state or the relatively constant period of V̇E. Note that these phases are not the same as the 3 phases of the rise in V̇O2.

|
|
|
Mild |
Moderate |
Heavy |
Maximal |
|---|---|---|---|---|---|
|
|
Rest |
25-30% |
55-60% |
85-90% |
100% |
|
Paco2 (mmHg) |
40 |
38 |
36 |
33 |
31 |
|
Pao2 (mmHg) |
95-100 |
95 |
95 |
95 |
95 |
|
Sao2 (%) |
97 |
97 |
97 |
96 |
95 |
|
pH |
7.40 |
7.38 |
7.34 |
7.29 |
7.28 |
Values from Romer, Sheel and Harms ; The Respiratory System.
Key Points
During exercise, pulmonary ventilation increases and there is a highly synchronized series of changes which serve to control the intra- and extra-thoracic airways. The patterns of breathing serve to minimize the work done by the inspiratory and expiratory musculature.
Lung Mechanics During Exercise
Airway Caliber
During dynamic exercise, both inspiratory and expiratory flow rates increase in order to meet ventilatory demands. It is important that the caliber (diameter) of the airways increase with increasing ventilatory demands to prevent increases in airway resistance, which would place an intolerable load on the ventilatory muscles. Several key mechanisms serve to accomplish this. The upper airway, consisting of the nasal, pharyngeal and laryngeal airways, comprises most of the total respiratory system resistance to airflow in a healthy adult and is highly susceptible to narrowing during inspiration. During (and following) exercise it is known that the resistances of the nasal, pharyngeal and laryngeal portions of the upper airway are reduced in proportion to exercise intensity. In general, at approximately 20-40 L·min–1 V̇E there is a change in the primary route of airflow from high resistance nasal routes (i.e. breathing through the nose) to the lower resistance oral route (i.e., mouth breathing).
During strenuous exercise, when ventilatory rates are high, the intra-thoracic airways are susceptible to narrowing via constriction of bronchiolar smooth muscle (bronchoconstriction). Inflammation may also narrow intra-thoracic airways during the hyperpnea of exercise, especially in the face of evaporative water losses from the airway mucosa or release of inflammatory mediators from mast cells lining the airway. However, in a healthy person exercising in temperate conditions the intra-thoracic airway resistance is reduced during and following exercise. This supports the concept of a strong exercise-induced bronchodilation during exercise, when compared to rest. The regulation of upper airway caliber during exercise is dependent upon three factors:
(1) vascular tone in the nasal mucosa;
(2) activation of key skeletal muscles of the upper airway, which stiffen the airway; and
(3) passive dilation of the airway. Each of these mechanisms serves to maximize the caliber of the airways.
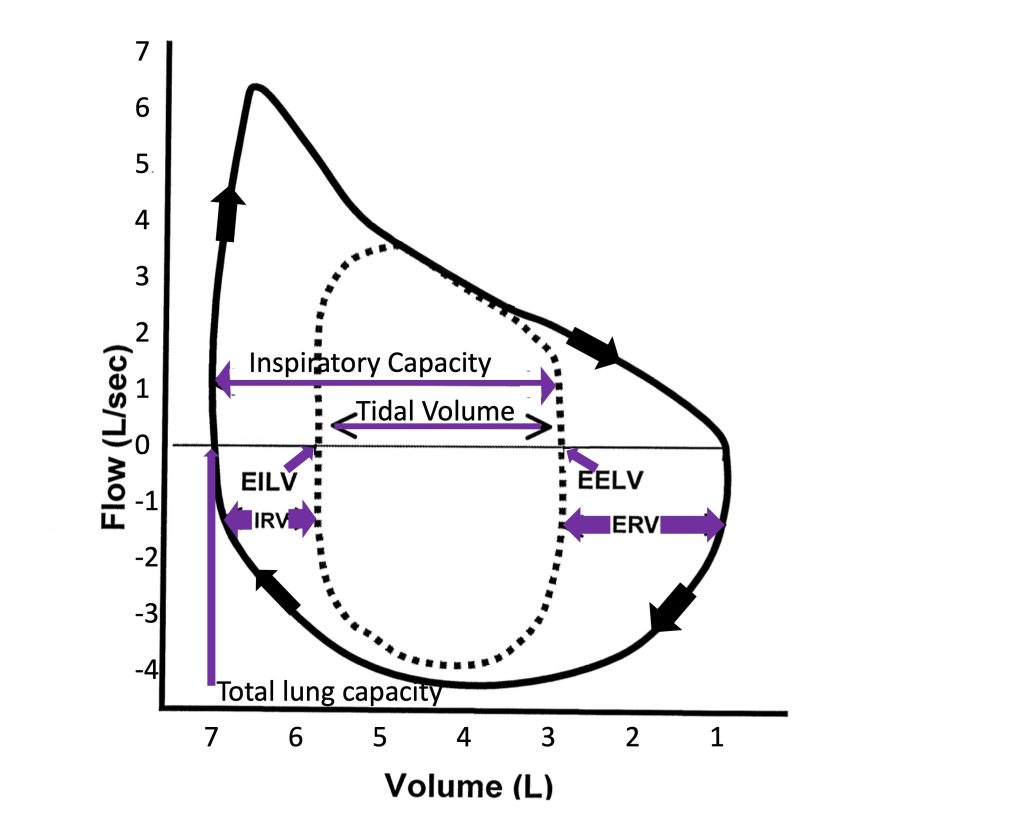
Flow-Volume
During ventilation, the rate of movement of air and airway resistance are dictated by airway radius. As mentioned, there are important mechanisms in place that maximize airway radius in order to accommodate the substantial ventilatory load of exercise. The increase in ventilation occurs because of increases in breathing frequency and tidal volume. Tidal volume increases with increasing exercise intensity until approximately 50-60% of vital capacity is reached. Thereafter, any further increase in ventilation will be achieved by increasing breathing frequency alone at a constant tidal volume. Maximal expiratory flow-volume loops are used to graphically present the relationship between maximum possible flow and lung volume across the range of volume from total lung capacity (TLC) to residual volume (RV). This volume is also referred to as forced vital capacity (FVC). In healthy individuals, these expiratory curves have a distinctive shape resulting from a rapid rise to maximal expiratory flow with the onset of expiration from TLC, followed by a steady reduction in flow rate with falling lung volume. The maximal flow volume defines the limits of the airways and ventilatory muscles to produce flow and change volume during exercise. By examining these loops (see Figure 7-6) one can see that the mechanical properties of airways and lungs for flow and volume appear ideally designed for exercise. The maximal flow-volume loop (i.e., capacity) is much larger than the peak flow rate and tidal volume reached at maximum exercise (i.e., demand) in a healthy person.
Ventilatory Muscle Energetics
Homeostasis of respiratory gases in the blood is reliant upon the coordinated changes that link tissue metabolism, alveolar ventilation, cardiac output and peripheral blood flow. The pulmonary system in the young, healthy adult responds to dynamic exercise with remarkably precise regulation of alveolar ventilation that is matched to metabolic demand. Even during strenuous sea-level exercise the arterial partial pressures of oxygen and carbon dioxide and arterial pH remain close to resting values indicating that the neuromechanical regulation of alveolar ventilation is highly effective. Exchange of air between the atmosphere and the alveoli is dependent, in part, upon the mechanical properties and interactions between the lung, the surrounding anatomy including the chest-wall, the abdomen, and the ventilatory muscles that act upon them. The ventilation that accompanies exercise requires contraction of the ventilatory pump muscles. Contraction of these muscles permits increases in VT and fb during exercise and thus appropriate pulmonary gas exchange. Like the contraction of skeletal muscle there is an energy cost associated with the work of breathing. At rest, the O2 consumption of the ventilatory muscles is approximately 3-5% of V̇O2. At maximal exercise this can increase to 8-10% of V̇O2max in healthy individuals and as much as 13-16% V̇O2max in highly trained endurance athletes (Aaron et al. 1992). The work of breathing can be divided into two categories:
- elastic work, which involves altering the shape of the anatomical structures involved, and
- resistive work, which is necessary to overcome the resistance to airflow in the airways.
In general, the ventilatory response to exercise is thought to be governed by the principle of “minimal effort” (Macklem 2002). This concept is supported in two ways. First, models describing the work of breathing indicate that the ventilatory patterns naturally observed during exercise are the least costly in terms of energy expenditure. Second, ventilation during exercise occurs within a range of lung volumes for which total lung compliance is greatest. This means that the amount of work performed on the lungs and chest wall to achieve a given tidal volume is minimized compared to higher or lower lung volumes.
The total work of inspiration and expiration is substantially higher during exercise than at rest because fb and VT are increased. Elastic work increases substantially as tidal volume increases relative to rest. Once VT reaches a plateau, elastic work decreases with increasing fb because more of the elastic energy that is stored in the chest wall and lung during inspiration is recovered during expiration. The resistive work of breathing increases significantly as flow-rate increases because of increases in turbulent airflow.
As one would expect, the work of breathing will increase when V̇E increased, and therefore, the recruitment of motor units in the ventilatory muscles is increased and energy demand placed on the ventilatory muscles is increased as well. It has been shown that the metabolic and circulatory costs of a high work of breathing during maximal levels of ventilation amount to 10% of V̇O2max in the untrained person, and up to 15-16% of V̇O2 at maximal cardiac output in the highly-trained person (Aaron et al. 1992; Harms et al. 1997). This difference between trained and untrained individuals occurs because the trained person must achieve a greater V̇E to support the higher V̇O2max.
The ventilatory muscle oxygen cost at similar minute ventilations is greater in females and is increased by age. An older, male, of average fitness has a higher work of breathing compared with a younger male of average fitness. Ageing is associated with a loss of lung elastic recoil and the consequences of this include a reduction in maximal expiratory flow rate and an increase in functional residual capacity. The greater oxygen cost of breathing in females compared with males occurs because women have smaller airways, lung volumes, and maximal expiratory flow rates relative to men even when matched for lung size (Mead 1980; Sheel et al. 2009). Female athletes develop expiratory flow limitation (i.e., expiratory flow during tidal breathing intersects the maximum flow-volume envelope) more frequently than male athletes and have an increase in end-expiratory and end-inspiratory lung volume at maximal exercise. This pattern of lung inflation is called dynamic hyperinflation.
Key Points
The muscles of breathing are heavily recruited during exercise and there is a significant metabolic cost associated with this muscular contraction.
Control of Exercise Ventilation
The control of exercise ventilation has been studied extensively but still remains highly controversial and poorly understood. Before undertaking our discussion of the control of exercise ventilation we must understand the components of the basic respiratory control system and normal breathing at rest (eupnea).
Overview of the Ventilatory Control System
The ventilatory control system is schematically presented in Figure 7-7. It consists of three main components: central controller, sensory input and effectors.
The first component is referred to as the central controller. The central controller is made up of groups of neurons located within the medulla and the pons that work together to integrate sensory information and to produce efferent outflow to the ventilatory muscles. These groups of neurons are therefore responsible for generating the ventilatory rhythm and pattern. They determine the length of inspiration and expiration, the rate of inspiration and expiration, and finally the volumes of inspiration and expiration. Since the ventilatory system is affected by sleep/wake state, phonation/speaking, emotion, body temperature, locomotion, learning and experience, it also receives inputs from higher brain structures such as the hypothalamus. This information allows breathing to occur automatically during a variety of activities and states, yet allows voluntary override when the need arises. We do not have to consciously alter our breathing during tasks like speaking, coughing, chewing, and swallowing which all involve the same airway and ventilatory muscles. Throughout these activities the ventilatory system is capable of regulating arterial PO2 and PCO2 within a narrow range (±1-2 mmHg).

The second component of the ventilatory control system is the sensory input. Sensory inputs include peripheral and central chemoreceptors, mechanoreceptors and metaboreceptors of the lung and skeletal muscle. These receptors provide information regarding the chemical or humoral state of the blood, mechanical changes such as distention or compression of muscles, blood vessels, or the lung wall, and metabolic changes in the muscles of both the ventilatory and locomotor muscles.
The third component of the ventilatory control system is the motor output or effectors. The effectors include the neural connections leaving the central controller and the ventilatory muscles that they stimulate. The motor output from the central controller activates with synchronization of the appropriate ventilatory muscles. In the following sections, each component of the ventilatory control system will be further discussed.
Central Controller
The central controller involves neurons located throughout the ventral lateral medulla, and consists of pacemaker neurons that generate the intrinsic oscillations required for the basic pattern of breathing. An extensive neuronal network is also present and is responsible for pattern generation and fine-tuning breathing by integrating sensory and supramedullary inputs. Figure 7-8 shows a lateral view of the brainstem and highlights several distinct areas of ventilatory neurons: the pontine respiratory group (PRG), the dorsal respiratory group (DRG), the ventral respiratory group [divided into the rostral (rVRG) and caudal (cVRG) ventral respiratory group], the retrotrapezoid nucleus (RTN), the Bötzinger complex, and the preBötzinger complex. Nuclei within the PRG receive vagal afferent inputs that provide information relating to lung volume. These neurons are therefore important for limiting the rate and depth of breathing. The DRG receives bulbospinal inspiratory neurons and afferents from the peripheral chemoreceptors. It is likely an important site for sensory integration. The RTN contains both inspiratory and expiratory neurons that project to neurons within the rVRG. The importance of the RTN is not well understood but it may serve as a site of central chemoreception. The cVRG contains bulbospinal expiratory neurons that excite internal intercostals and abdominal motor neurons during expiration. The rVRG contains bulbospinal expiratory neurons that excite inspiratory muscles such as the diaphragm. The Bötzinger complex contains expiratory bulbospinal premotor neurons and excitatory interneurons. Finally, the preBötzinger complex contains pacemaker neurons that generate the basic ventilatory rhythms.

Sensory Inputs
Sensory inputs to the central controller provide information about the chemical and metabolic status of the blood and muscles, and mechanical information such as stretch of the lung. This section describes the peripheral chemoreceptors, central chemoreceptors, metaboreceptors, and mechanoreceptors.
Peripheral Chemoreceptors
The chemoreceptors are located bilaterally at the bifurcations of the common carotid arteries. They are highly vascularized and are sensitive to changes in arterial Po2, Pco2, and potassium ion concentration. The sensory activity from the peripheral chemoreceptors is projected to the brainstem medullary respiratory neurons through the carotid sinus nerve where it synapses with neurons located within the nucleus of the solitary tract.
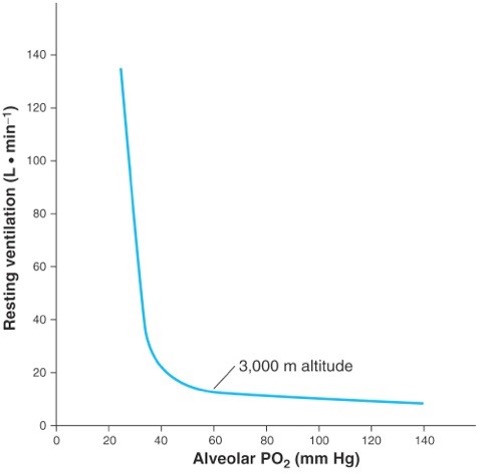
The peripheral chemoreceptors are the only receptors in the human body responsible for stimulating ventilation in the presence of hypoxia. There is a curvilinear relationship between ventilation and arterial Po2 in hypoxia, as would be experienced on going to altitude (see Figure 7-9). This relationship becomes linear when ventilation is plotted against arterial oxyhemoglobin saturation, showing that the relationship between . The slope of this relationship is generally referred to as the hypoxic respiratory response. This response is blunted (i.e. slope more shallow) if the level of arterial Pco2 is held below the resting level (hypocapnic) and augmented (i.e. steeper slope) if the arterial Pco2 is held above the resting level (hypercapnic). This modulation of the respiratory response provides evidence that both O2 and CO2 are detected and impact ventilation.
The ventilatory response to increases in arterial Pco2 is illustrated in Figure 7-10 and is a linear relationship. The slope of this relationship is typically referred to as the hypercapnic ventilatory response. The level of arterial Po2 also affects this response such that the slope of the response is decreased with hyperoxia and increased with hypoxia.
Finally, the peripheral chemoreceptors stimulate increases in ventilation when there are increases in potassium ion concentration and when pH decreases. With heavy exercise, potassium ion concentration increases and pH decreases; these changes may contribute to the hyperventilation that occurs with heavy exercise.

Central Chemoreceptors
Central chemoreceptors are located throughout the ventral lateral surface of the medulla. Some important locations identified to contain central chemoreceptors include the rostral ventral surface of the medulla in the vicinity of the retrotrapezoid nucleus, the ventral medullary raphé, the rostral aspect of the ventral respiratory group, the nucleus of the solitary tract, and the locus ceruleus. The central chemoreceptors are sensitive to changes in of the interstitial brain fluid that result with changes in arterial Pco2. The ionic composition of cerebral spinal fluid is closely regulated by the blood-brain barrier. However, changes can occur rapidly in the brain because CO2 is able to quickly cross the blood brain barrier and quickly reacts with H2O to form carbonic acid. Carbonic acid then dissociates to form bicarbonate and H+ ions thereby decreasing pH. The ventilatory response to hypercapnia is due to stimulation of both peripheral and central chemoreceptors. Generally, the peripheral chemoreceptors contribute the most to the initial response, as they are fast to respond while the central chemoreceptors contribute more to the steady state response.
Metaboreceptors
are located throughout the ventilatory and locomotor muscle vasculatures. Specifically they are found in the muscle interstitium in close proximity to blood vessels. Metaboreceptors provide feedback to the central controllerthrough type IV afferents regarding the metabolic state of the skeletal muscles. The firing rate of type IV afferents increases with increases in the concentration of hydrogen and potassium ions. This information has a stimulating effect on ventilation.
Mechanoreceptors
Mechanoreceptors provide feedback to the central pattern generating neurons regarding the mechanical state of the lung, airways, and locomotor muscles. Feedback is sent to the central control system through type III afferents. In the lung, mechanoreceptors are found in the parenchyma and respond to lung stretch corresponding with increased volume. The firing rate of these afferents increases with increasing lung volume and inhibits ventilation.
Mechanoreceptors are also found in airway skeletal muscle fibres and respond to pressure and airway wall deformation. This information is important for directing activity to pharyngeal and laryngeal musculatures for abducting and stiffening the airway. This is important to protect upper airway patency and prevent airflow limitation.
Efferent Output
Once the central controller has processed sensory information an appropriate response is prepared and sent to the ventilatory muscles. This efferent activity can be described during the three phases of ventilation: Inspiration, post-inspiration, and expiration. Discharge to the diaphragm through the phrenic nerve increases progressively during inspiration. During the post-inspiratory phase, phrenic neural activity dramatically drops and slowly tapers off. Phrenic discharge is silent during expiration. The 10th and 11th thoracic spinal motor nerves innervate the internal intercostal muscles. Excitation of the internal intercostals muscles acts to draw the ribs down and together thereby compressing the thoracic cavity. This increases pleural pressure and assists in expiration. During resting ventilation activity of the internal intercostals would be low as expiration is passive. But during exercise the activity of these muscles becomes very important to assist with expiration. The 5th and 6th thoracic spinal motor nerves innervate the external intercostal muscles. Excitation of the external intercostal muscles acts to lift and expand the rib cage. This has the effect of decreasing pleural pressure and thereby enhances the pressure gradient for air to enter the lungs.
Exercise Hyperpnea
Now that we have a basic understanding of the control of breathing it is possible to consider how breathing is controlled during exercise. How does the central controller know to increase ventilation during exercise? The increase in breathing with exercise is referred to as exercise hyperpnea because arterial Pco2 is typically maintained. During strenuous exercise, ventilation may increase out of proportion to carbon dioxide production (V̇CO2) and arterial PCO2 decreases below resting levels. This is referred to as exercise hyperventilation.
The increase in ventilation with exercise must meet two specific demands. First, increases in V̇A must be proportional to the increase in metabolic use of O2 by the working muscles. Such increase in V̇A must meet the guidelines set by the alveolar gas equation. Second, the work and metabolic cost of increasing ventilation should be minimal such that O2 delivery and cardiac output are conserved for the locomotor muscles.
Relationship Between Alveolar Gas and Metabolic Requirements
The increase in ventilation with exercise is related to the increase in metabolic demand. The alveolar gas pressures for O2 and CO2 (PAO2 and PACO2 respectively) can be related to V̇O2 and V̇CO2 by variants of the alveolar gas equation. The relationship between, V̇A, V̇O2 and PAco2 is:
where PAco2 is the alveolar partial pressure for carbon dioxide (in mmHg), V̇CO2 is carbon dioxide production (in ml·min-1), V̇A is alveolar ventilation (in L·min-1) and K is a constant (equal to 0.863).
The relationship between V̇A, V̇O2and Pao2 is:
PAO2 = PIO2 – V̇O2 · V̇A -1 · K
where Pao2 is the alveolar partial pressure for oxygen (in mmHg), Pio2 is the inspired partial pressure for oxygen (in mmHg, 150 mmHg at sea level), V̇O2 is oxygen consumed (in ml·min-1), V̇A is alveolar ventilation (in L·min-1) and K is a constant (equal to 0.863).
Example: An athlete has a resting oxygen consumption of 300 ml·min-1 and a resting carbon dioxide production of 240 ml·min-1. At sea level the athlete has normal alveolar gas pressures of 40 mmHg for CO2 and 100 mmHg for O2. During exercise, the athlete increases their metabolic rate six times and alveolar gas pressure for oxygen increases to about 110 mmHg. What is the alveolar ventilation at rest and during exercise? What is the Paco2 during this exercise?
Based on the above data you should be able to determine that the alveolar ventilation at rest is 5 L·min-1 and during exercise is 39 L·min-1. If alveolar ventilation during exercise is 39 L·min-1 and the carbon dioxide production is 1440 ml·min-1 then the alveolar partial pressure for CO2 during exercise is 32 mmHg.
The matching of metabolic demand and alveolar ventilation is essential. This is the first line of defense in the oxygen transport system. Alveolar ventilation is capable of increasing rapidly and precisely to meet the body’s oxygen demand. Alternatively, alveolar ventilation must control arterial carbon dioxide within a narrow range so as to maintain arterial blood acid base homeostasis
Exercise Hyperpnea Control Hypotheses
What drives ventilation during exercise? The mechanisms involved in controlling the ventilatory response to dynamic exercise have been studied for over a century and there remains controversy over what causes the onset of increased ventilation and what controls its level afterwards. In this section, three hypotheses will be briefly described and include:
- the central locomotor command hypothesis,
- the CO2 flow hypothesis
- the locomotor muscle mechanoreceptor/metaboreceptor hypothesis.
It is likely that all three hypotheses are simultaneously involved during exercise. The contribution of each hypothesis to the ventilatory phases of submaximal exercise will also be described.
Central Locomotor Command Hypothesis
Unlike the CO2 flow and muscle afferents hypotheses, the central command hypothesis is a feed-forward pathway rather than a feed-back pathway. With this hypothesis ventilation is stimulated directly by supramedullary locomotor centre neurons. These neurons are found in regions of the hypothalamus, the diencephalons of the midbrain, and in the premotor cortex. Excitation of exercise and respiratory circuits is parallel and simultaneous and ventilation would therefore increase concurrently with the beginning of locomotion (Eldridge et al. 1985). This hypothesis likely contributes extensively to the phase 1 ventilatory response to exercise.
CO2 Flow Hypothesis
The CO2 flow hypothesis states that exercise ventilation is influenced by afferents sensing CO2 flow in the lung or in the right side of the pulmonary circulation. This hypothesis is represented by the equation:
CO2Flow = Q̇ · CvCO2
where Q̇ is pulmonary blood flow in L·min-1 and CvCO2 is the CO2 content of mixed venous blood in mL CO2 per 100mL of blood. A close relationship exists between increases in alveolar ventilation to CO2 production with steady-state exercise (Phillipson et al. 1981). Also, for this reason, this hypothesis is thought to contribute the most to the control of ventilation during the third phase of sub maximal exercise. This hypothesis is attractive because typically during exercise there is no change in arterial Pco2 and increases by only a small amount. Therefore, it is otherwise unlikely that the peripheral chemoreceptors could be involved in exercise ventilation. However, CO2 flow to the lung is not the sole contributor to exercise ventilation. Contribution from locomotor receptors and central command is also important.
Locomotor Muscle Mechanoreceptor/Metaboreceptor Hypothesis
Feedback from working locomotor muscles is another hypothesis thought to contribute to the control of exercise hyperpnea. With this hypothesis, mechanical stimuli such as stretch, pressure, and tension of skeletal muscle and tendons is sensed by type III nerve afferents and metabolic stimuli such as and bradykinin is sensed by type IV afferents (Kaufman and Forster 2011). This information is sent to the central controller and influences ventilation. Information from type III and IV afferents plays an important role in stimulating the initial phase 1 ventilatory response to exercise and also is involved in the slower increase in ventilation toward steady state or the phase 2 response.
Regulation of Ventilation During High-Intensity Exercise
The regulation of ventilation during high-intensity exercise remains a topic of debate. During submaximal exercise blood is near-normal but with heavier exercise there is significant lactacidosis and increases in other blood substances (e.g., potassium, catecholamines). Exercise-induced changes in these substances within arterial blood are known to excite the carotid chemoreceptors suggesting that they contribute to the hyperpnea of heavy exercise. Indeed many experimental approaches have yielded impressive correlative data linking a given humoral stimuli and exercise ventilation. On the other hand, when the carotid body is removed in experimental animals the ventilator response to exercise remains intact (Pan et al. 1986). The general consensus is that the carotid bodies are not the primary transducer of the hyperventilatory response. Rather, they may serve to ‘fine tune’ the regulation of ventilation during heavy exercise.
Key Points
Our understanding of the mechanisms that control ventilation during exercise remains incomplete. It is difficult, if not impossible, to identify a given mechanism as the ‘primary driver’ of exercise hyperpnea. It is likely that in the intact state (i.e., whole organism) the integrated ventilator response incorporates both feed-forward and feed-back mechanisms and that there is considerable redundancy in control mechanisms.
Pulmonary Gas Exchange
Demands of Exercise
As mentioned in the introduction to this chapter, exercise places unique demands on the body that must be accommodated by the ventilatory system. During exercise, the metabolic rate can increase 10-20 fold over resting values. As such, both oxygen delivery and carbon dioxide elimination must increase to meet these demands. It is the job of the ventilatory system (in conjunction with the cardiovascular system) to ensure adequate oxygen delivery and removal of waste CO2 at all intensities of exercise. In the healthy exercising human, even at maximal exercise, CO2 levels in the blood do not rise and in the majority of people O2 levels remain constant, demonstrating the effectiveness of the ventilatory system in meeting these demands.
When we talk about the amount of physiological work done by the exercising human we talk about metabolic rate. Metabolic rate is typically expressed as a measure of oxygen consumption. Physiologists usually express oxygen consumption in L·min-1 or mL·kg-1·min-1. The former unit is used for absolute oxygen consumption, whereas the latter is used for relative oxygen consumption, taking body mass into account. It is appropriate to use absolute when the energy cost of the exercise is independent of body mass (like swimming or cycling on an ergometer) and relative when the exercise is dependent on body mass (like running and walking). In contrast clinicians use a different unit (called the MET) to measure metabolic rate. One MET approximates resting metabolic rate and is equivalent to 3.5 mL·kg-1·min-1. During exercise if an individual is exercising at 10 METs, then their oxygen consumption is equivalent to 10 times their resting metabolic rate. Very fit athletes will be able to perform up to 20 METs of work at maximal exercise (the intensity that elicits maximal oxygen uptake).
To interpret gas exchange during exercise, we not only assess oxygen consumption, (V̇O2), but also carbon dioxide production (V̇CO2). The ratio of carbon dioxide production to oxygen consumption depends on the fuels being utilized. Each of the primary fuels for exercise (carbohydrate, protein and fat) produce slightly different amounts of carbon dioxide for a given amount of oxygen consumed. This ratio of carbon dioxide production to oxygen consumption ( V̇CO2/V̇O2) is called the respiratory quotient (RQ) when it represents the true metabolic gas exchange. For example in the metabolism of glucose we see the following reaction:
C6H12O6 + 6 O2 6 CO2 + 6 H2O
Six molecules of O2 are consumed, and 6 molecules of CO2 are produced, giving a of 6/6 or 1.0. Conversely, when palmitic acid (a fatty acid) is metabolized we get the following equation:
C16H32O2 + 23 O2 16 CO2 + 16 H2O
Twenty-three molecules of O2 are consumed and only 16 molecules of CO2 are produced, giving us a of 0.7. By comparison, the RQ of protein metabolism is typically in the range of 0.8-0.9. When we calculate the RQ, we are using it to reflect the specific gas exchange that is occurring at the tissue level. In exercising humans, we cannot easily measure these tissue values, so instead we look at the ratio of whole body V̇CO2 and V̇O2 measured across the pulmonary system. This whole body ratio is called the respiratory exchange ratio (RER), and represents the ratio of whole body V̇Co2/V̇o2. During rest and low and moderate intensity exercise we can use the RER to estimate the relative contributions of and carbohydrate to oxygen consumption. For example, we notice at lower intensities, that individuals typically have values below 0.85, reflecting a relative preference for lipid metabolism. As exercise intensity increases, RER gets closer to 1.0, indicating a transition to carbohydrates as the predominant fuel source.
Oxygen Transport
Oxygen is relatively insoluble in bodily fluids. For example for a partial pressure of oxygen in the alveolus (Po2) of 100 mmHg, only 3 mL of oxygen dissolves in the blood for each litre of blood. With this oxygen carrying capacity, the cardiac output would have to be (3.5 ml·min-1* 60 kg·(3ml·litre-1) -1 =70 litres·min-1 for a 60 kg person (assuming total extraction). The capacity of dissolved oxygen in fluids is clearly inadequate. Instead, humans use haemoglobin (Hb) to boost the oxygen carrying capacity of the blood. Haemoglobin is an iron-containing metalloprotein pigment in the erythrocytes (red blood cells) that enhances oxygen carrying capacity of the blood by approximately 70-fold. At rest, the 60 kg individual mentioned above would have a cardiac output of about 4 litres·min-1 with extraction of only 25% of the available O2. Each haemoglobin molecule can bind up to 4 oxygen molecules and the binding of Hb to O2 is directly related to PO2. At a high arterial PO2 (100 mmHg for example) the saturation of Hb is nearly 100%. As PO2 drops, then the number of O2 binding sites that are occupied by O2 decreases. Typically Hb is 50% saturated with O2 at a PO2 of 60 mmHg. When haemoglobin is saturated with oxygen molecules, it is called oxyhaemoglobin, conversely, desaturated Hb is referred to as deoxyhaemoglobin. The binding of oxygen to haemoglobin demonstrates cooperative binding. This means that each oxygen molecule that binds to one of the four sites on the haemoglobin increases the affinity for binding of subsequent oxygen molecules. This behaviour explains the sigmoidal shape of the haemoglobin oxygen dissociation curve (Figure 7-11).
The affinity of Hb for O2 also varies based on tissue conditions. Circumstances influence binding of O2 to Hb; 2,3 diphosphoglycerate (2,3 DPG), CO2, and temperature affect binding. These circumstances allow a higher Hb-O2 affinity at the lung where is preferred, and enhanced dissociation at the level of exercising tissue where the O2 unloading is preferred. The factors that favour enhanced dissociation are all present in exercising muscle. These are a low pH, a high PCO2, high temperature, and an increase in the concentration of 2,3 DPG. 2,3 DPG is a 3-carbon molecule that is present within the erythrocytes due to glycolysis. It acts by binding to deoxyhaemoglobin and stabilizing it in its deoxygenated state, thus promoting oxygen dissociation. Conversely when the haemoglobin returns to the lung, these conditions are reversed, favouring enhanced binding of O2 to Hb. This shifting of the Hb-O2 dissociation curve is termed the Bohr effect (Figure 7-11).

Within the muscle cells, oxygen transport is facilitated by myoglobin, another iron-containing globular protein, with a similar function to haemoglobin. In contrast, each molecule of myoglobin can only bind one molecule of oxygen instead of four. Since each myoglobin only binds to a single oxygen molecule it does not exhibit cooperative binding, and therefore it has neither a sigmoid dissociation curve like haemoglobin, nor does it exhibit the Bohr effect.
Ventilation-Perfusion
Gas transport relies on adequate lung ventilation to bring new oxygen to the alveoli and to remove CO2. Likewise, blood has to be pumped to these same alveoli in order to take up the oxygen and transfer the CO2 to the alveoli. Matching of these two processes (ventilation and perfusion) is key to effective gas exchange. When ventilation and perfusion are not adequately matched the phenomena of shunt and dead space occur. Shunting refers to blood that travels from the right side of the heart to the left side of the heart without exposure to ventilated alveoli, whereas dead space refers to inspired air that is exhaled without exposure to perfused alveoli. Shunt and dead space will now be described in detail.
Shunt
Shunt can occur within the pulmonary system or the heart. Intracardiac shunting occurs when blood travels directly from the right side of the heart to the left side of the heart through a direct communication such as a patent foramen ovale, or a ventricular septal defect. The foramen ovale is a portal between the right and left atria which is open during embryonic development, but which is meant to close soon after birth. However, in 25% of the population the foramen ovale fails to close completely, allowing some shunting from the right atrium to the left atrium. A ventricular septal defect is a direct communication between the ventricles that remains open due to an abnormality during development. Ventricular septal defects occur much less frequently than patent foramina ovale and cause more substantial shunts.
Shunt can also occur in the pulmonary circulation. Certain individuals with a condition called hereditary haemorrhagic telangiectasia (also called Osler-Weber-Rendu Syndrome) have direct interfaces between the arterial and venous circulations within the lung. These connections are called arteriovenous malformations. One of the clinical findings in people with pulmonary arteriovenous malformations (AVMs) is that they demonstrate platypnea, which means that when they sit up they become more short of breath. This platypnea occurs because as they sit up, a greater proportion of their cardiac output is shunted through the lower regions of the lung where the AVMs occur, leading to low levels of arterial oxygen (hypoxaemia) and increased levels of arterial carbon dioxide (hypercarbia). The hypoxaemia and the hypercarbia cause the sensation of shortness of breath (dyspnea).
A potential intrapulmonary shunt has also been demonstrated in athletic individuals without any medical condition. Termed exercise-induced intrapulmonary shunt, researchers have shown that an intrapulmonary shunt seems to occur in the majority of athletic individuals during exercise. Using a technique called contrast echocardiography, researchers inject agitated saline that contains small bubbles (called microbubbles) that are easily visualised with a cardiac ultrasound (echocardiogram). To look for shunt, these microbubbles are injected on the venous side of the vascular system and visualised as they travel through the right side of the heart. If the microbubbles are immediately visible on the left side at the same time or soon after they appear on the right side of the heart, an intracardiac shunt is suspected. If instead, the bubbles appear on the left side after a delay, then it is suggested that the shunting occurred outside the heart but somewhere in the pulmonary vascular system (an intrapulmonary shunt). This intrapulmonary shunt has been shown to be more common during exercise in hypoxic conditions, and seems to be preventable with hyperoxia.
Dead Space
Anatomic dead space has already been discussed previously in the chapter and is different from physiologic dead space. Instead of referring to an anatomic subsection of the lung in which no gas exchange takes place, physiologic dead space is a functional definition. It includes parts of the lung that are not perfused at all, but will also comprise areas that are poorly perfused, providing an assessment of the gas exchange capacity of the lung. In healthy individuals, anatomic and physiologic dead space are very close in value, whereas individuals with lung disease can have a much larger physiologic than dead space.
Physiologic dead space is calculated using Bohr’s method:
VD · VT -1= (Paco2 – Peco2 ) · Paco2-1
Where VD and VT represent dead space and tidal volume, respectively. PAco2 and PEco2 represent alveolar and mixed expired partial pressures of CO2, respectively. Often arterial Pco2 is substituted for alveolar Pco2 in this equation, because they are nearly equivalent in healthy individuals. The partial pressure of end-tidal CO2 (PETCO2) can be used as a measure of PAco2 and eliminate the need for arterial puncture or catheterization.
Distribution of Ventilation
Ventilation is not homogenous across the lung. There are regional differences in ventilation of the lung, mostly due to the effects of gravity. Because of the weight of the lung, the intrapleural pressures are more negative in the upper parts of the lung than in the lower parts of the lung. This difference causes the alveoli in the lower parts of the lung to have a smaller resting volume than the upper parts of the lung. Said differently, this means that the base of the lung is relatively compressed in the resting state but expands more on inspiration than the apex. During inspiration, the lower parts of the lung take up a greater proportion of the inspired air than the upper areas. This relationship varies depending on the degree of lung inflation. In fact, at very low lung volumes, the upper regions of the lung are better ventilated than the lower regions.
At the end of expiration when the volume in the lung is low, not all of the air is allowed to leave the alveoli. Respiratory bronchioles can close before the alveoli are empty, leading to gas trapping or airway closure. This occurs at only very low lung volumes (not normally found during exercise) in healthy young people. With age, healthy people slowly lose the elastic recoil in their lungs. This loss of elasticity causes intrapleural pressures to be less negative, and lead to airway closure at higher lung volumes. As the loss of elastic recoil becomes more apparent, airway closure can occur above functional residual capacity, leading to impairment in gas exchange.
Distribution of Perfusion
As with ventilation, perfusion is also not uniformly distributed. The pressures exerted on the arterial and venous components of the pulmonary vasculature vary in different regions of the lung. Gravity affects the perfusion pressure of the lung such that perfusion pressures are higher in the dependent (lower) regions of the lung, and lower in the upper regions of the lung. These pressure differentials are affected by posture and body position during exercise. For example, during supine exercise such as recumbent cycling the posterior parts of the lung would be dependent and demonstrate higher perfusion pressures whereas during road cycling (leaning forward) these same areas would show a relative decrease in perfusion pressure. In certain situations there may be a region in the lung where arterial pressure is lower than alveolar pressure. In this situation, the alveolar pressure occludes the pulmonary capillary and there is no perfusion at that alveolus. This particular phenomenon leads to dead space. Figure 7-11 displays the regional differences in lung perfusion.
Ventilation-Perfusion Matching
To strive for optimal gas exchange, the body attempts to match ventilation-perfusion ratio to perfusion. The relationship between ventilation and perfusion on a whole body level is described by the ventilation-perfusion ratio. For example, at rest, average ventilation would be 4.2 L·min-1, while perfusion (cardiac output from the right ventricle) would be 5 L·min-1. This situation gives us a ventilation-perfusion ratio of 0.84. This ratio remains essentially unchanged during light exercise, but during heavy exercise, as ventilation increases disproportionately to oxygen consumption, the ventilation-perfusion ratio can increase substantially. It is not uncommon for ventilation during heavy exercise to be in the range of 150 L·min-1 for a corresponding perfusion of about 30 L·min-1, giving a ventilation-perfusion ratio of 5.
We have already covered the regional differences in both ventilation-perfusion ratio and perfusion as a result of the effects of gravity and lung mechanics on various areas of the lung. Typically, ventilation increases as you move from the top of the lung to the bottom of the lung. Similarly, perfusion also increases but in a much greater magnitude of change. This situation can lead to significant variation in ventilation-perfusion ratio in different regions of the lung. One strategy used to somewhat mitigate this potential for variation is hypoxic pulmonary vasoconstriction (HPV). The smooth muscle in the walls of the small pulmonary arterioles can constrict in response to hypoxic conditions, increasing pulmonary vascular resistance by up to 300%. Interestingly, this phenomenon occurs primarily in response to alveolar and not arterial hypoxia. Alveolar hypoxia presumably causes vessel wall hypoxia, which is sensed in the vessel smooth muscle wall, causing contraction and vasoconstriction. The effect of this response is to decrease blood flow to poorly ventilated areas of the lung, diverting it to the better-perfused areas. In contrast, at high altitude the entire lung becomes hypoxic, leading to a global hypoxic pulmonary vasoconstriction and resultant rise in pulmonary artery pressure. High altitude pulmonary oedema (HAPE) is a potentially lethal condition that can develop in highly sensitive visitors to high altitude (approximately 2500 meters above sea level or higher). These susceptible individuals develop a form of exaggerated hypoxic pulmonary vasoconstriction, which is presumed to cause leakage of fluid from the pulmonary capillaries into the alveoli. This build-up of fluid in the alveoli leads to impairment in gas exchange, causing significant hypoxaemia, illness, and often death. HAPE is exacerbated by exercise, presumably as it increases cardiac output, and therefore pulmonary artery pressure, which would increase the potential for leakage of fluid into the lung. The ultimate treatment for HAPE is descent back to a lower altitude that has higher partial pressure for O2, where the condition resolves spontaneously within a couple of days.
Diffusion
Diffusion of a gas through a tissue is governed by Fick’s law (see below). Diffusion is the process where a substance goes from an area of higher concentration to an area of lower concentration. It is a passive process that that does not require energy. In respiratory physiology, diffusion refers to the movement of gas across the distance and barriers between the alveoli and the blood. The rate of diffusion is proportionate to the area of the membrane, and the difference in partial pressure of the gas across the membrane. Diffusion is inversely proportional to the thickness of the membrane. The area of the blood gas interface in the lung is approximately 70 square metres, and it is as thin as 0.3 m. Solubility of each particular gas is also important. For example CO2 diffuses about 20 times more rapidly than O2 across the blood alveolar interface due to its much higher solubility in body fluids.
The rate of transfer of gas across the barrier between the alveolus and the capillary is not only modulated by the direct tissue barrier. Resistance to diffusion also comes from the path that the gas molecule (such as O2 or CO2) takes through the capillary plasma and erythrocyte cytoplasm to ultimately bind with the haemoglobin molecule. Resistance comes from both the distance of diffusion through the blood as well as the rate of reaction between the CO2 and O2 molecules with the haemoglobin molecule. Typically the process of diffusion is regarded as a two-component process, with the two components being the membrane component and the blood component. The membrane component comprises the process of diffusion from the alveolus, across the respiratory membrane (including the diffusion through the plasma and the erythrocyte cytoplasm). The blood component comprises the reaction between the gas molecules and the Hb molecule.
The diffusing capacity of the lung is described by the equation:
DL = V̇gas · (P1-P2)-1
Where DL represents the diffusing capacity of both lungs, V̇GAS represents the flow of the gas, and P1-P2 represents the difference in partial pressure from one side of the tissue to the other (i.e., alveoli-to-blood).
The diffusing capacity can be subdivided into it’s constituent components as:
1·DL-1 = 1 · DM-1 + 1 · Θ-1 · VC
Where DL represents the diffusing capacity of both lungs, DM represents the membrane component, and represents the blood component with VC as the capillary blood flow, and as the rate of reaction of O2 with Hb. We can therefore see that diffusing capacity can be affected by changes in the membrane or in the blood component. Examples of membrane changes would be pulmonary fibrosis (where scarring increases the resistance to diffusion across the membrane) or pulmonary oedema (where water impairs the transmission by increasing the distance). Examples of blood component changes that affect diffusing capacity would include anaemia. Anaemia is a term describing a number of conditions that cause a decrease in the red cell content of blood. Anaemia is one potential medical cause of poor performance in the athlete, and it is one of the first conditions to be screened for in the athlete presenting to medical care for unexplained poor performance or fatigue. Conversely, some people can develop a rare condition called polycythaemia, which causes an increase in the number of red blood cells, and thus Hb in the pulmonary vasculature, leading to an increase in diffusing capacity. Athletes can also cause spurious polycythaemia by blood doping or taking erythropoietin (EPO). In blood doping, an athlete increases their red cell mass by adding extra blood to their vascular system, either their own blood that has been previously removed and stored, or blood from a compatible donor. Erythropoietin is a hormone that signals the body to make more red blood cells.
During exercise, pulmonary blood flow increases dramatically, causing diffusing capacity to rise proportionately. Following intense exercise, this elevated diffusing capacity may take some time to return to baseline levels, due to an increase in post-exercise cardiac output.
Cardio-Pulmonary Interactions
The respiratory and cardiovascular systems interact extensively with each other. Not only do they share close quarters within the thoracic cavity, but also, they must work together to support oxygen delivery and carbon dioxide transport. There are two types of interactions that occur between the cardiovascular and respiratory systems. The first is mechanical interactions. Mechanical interactions occur due to the pressure changes that occur within the thoracic cavity due to breathing. Mechanical interactions can affect cardiac preload, afterload, and venous return. The second type of interaction is reflexive in nature and results from an integration of the cardiovascular and ventilatory control systems in the medulla. Such reflexes affect heart rate (ventilatory sinus arrhythmia), muscle sympathetic nerve outflow, and blood flow to the ventilatory muscles and limb muscles (metaboreflex). These mechanical and reflexive interactions will be described in the following section.
Mechanical Interactions between the Cardiovascular and Pulmonary Systems
Inspiration generates substantial negative pressures (with respect to pressure measured outside the body) within the thoracic space. This increases the transmural pressure gradient across the walls of the ventricles, increases cardiac preload, and improves ventricular filling. During inspiration, right atrial pressure is reduced and the pressure gradient for returning venous blood to the heart is increased. With expiration, the opposite effects impede ventricular filling. During expiration the pressures within the thoracic space are increased and the pressure gradient responsible for ventricular filling. is reduced. Similarly, the return of venous blood is reduced because its pressure gradient is also reduced. There is an effect of lung surface pressure upon the heart that can limit the facilitating effects of inspiration on ventricular filling. This occurs during exercise when larger lung volumes result and the cardiac fossa becomes less compliant.
Increases in venous return during inspiration and reductions in intrathoracic pressure can also be countered by an increase in abdominal cavity pressure caused by the descent of the diaphragm. Diaphragm descent can compress the abdominal inferior vena cava and hinder venous return from the lower extremities (Miller et al. 2005a, 2005b).
Although, negative thoracic pressure during inspiration increases venous return to the right heart, it does not necessarily lead to increased stroke volume from the left ventricle. There are two forces opposing left ventricular output during inspiration. The first is a reduction of left ventricular volume due to ventricular interdependence. The increased volume of the right ventricle shifts the interventricular septum and encroaches upon the left ventricle thereby reducing its compliance and its volume. Left heart output is also reduced during inspiration because of an increase in afterload. Afterload is increased because the pressure gradient that the left ventricle must overcome to eject blood is much greater during inspiration.
Reflexive Interactions between the Cardiovascular and Pulmonary Systems
Breathing has significant influences on sympathetic vasoconstrictor outflow. Sympathetic nervous system activity in a resting muscle vascular bed is reduced during the late inspiration and early expiration. It rises and peaks during mid expiration. This reflex is controlled by a neural pathway that senses stretch of the lung parenchyma providing feedback to the nucleus of the solitary tract, where input is integrated by a group of cardiopulmonary interneurons and efferent sympathetic nerves. The lung stretch is sensed by pulmonary stretch receptors found in the lung parenchyma.
Another reflex pathway dependent upon ventilation is the within-breath variation in heart rate. This is commonly referred to as ventilatory-sinus arrhythmia. This pathway is vagally mediated and is dependent upon tidal volume. Pulmonary stretch receptors sense the stretch of the lung and during inspiration as lung stretch increases there is an increase in heart rate. Alternatively, during expiration as lung stretch decreases the heart rate also decreases. Ventilatory sinus arrhythmia may improve ventilation-perfusion matching and/or minimize cardiac work (Ben-Tal et al. 2012). During inspiration when good air is entering the lungs the heart rate increases to increase perfusion of the lung. During expiration there is a lack of useful ventilation, heart rate decreases, and lung perfusion decreases.
The ventilatory muscle metaboreflex is important because it causes blood to preferentially perfuse the ventilatory muscles over exercising muscles as the ventilatory muscles become fatigued (Dempsey et al. 2003). Metaboreceptors within the ventilatory muscles sense the accumulation of metabolic byproducts and this reflexively increases sympathetic nervous system output to muscle vascular beds. The ensuing vasoconstriction diverts blood away from the exercising muscles to the fatiguing ventilatory muscles. In terms of exercise performance this limits the delivery of oxygen to the working peripheral muscles and limits overall performance.
Key Points
During exercise there are important cardiorespiratory interactions whereby the act of breathing can influence venous return, cardiac output and blood flow distribution.
Lessons from Elite Athletes
To this point we have presented the pulmonary system as a complex system but one that is capable of meeting the ‘challenges’ of exercise. The maintenance of homeostasis of oxygen in arterial blood is generally not a problem because of a lung and chest wall that are generally “overbuilt” with respect to maximum metabolic demands for gas transport. On the other hand, evidence is accumulating that the healthy pulmonary system in some humans may not be so “overbuilt” as fitness level increases, because the lung diffusion surface and airways, and perhaps even ventilatory muscles, do not adapt to the “training stimulus” anywhere near to the same extent as do other links in the oxygen transport scheme. The result is that the now relatively “underbuilt” pulmonary system in the fit subject contributes significantly to the limitations of exercise performance for two specific reasons: (i) diaphragm and (ii) exercise-induced arterial hypoxaemia (EIAH).
Diaphragm Fatigue
The human diaphragm is a large dome-shaped muscle that separates the abdominal and thoracic cavities and is the primary muscle driving active inspiration. Other muscles of inspiration include the external intercostals and accessory muscles (i.e., scalenes and sternocleidomastoid), which become recruited to a greater degree as ventilation increases. The diaphragm must sustain extremely high levels of force output and requires a high proportion of cardiac output during intense exercise. Given the significant demand for O2 and the high work of breathing that occurs during maximal exercise, it seems possible that the diaphragm, like other skeletal muscle, can be susceptible to (Johnson et al. 1993).
Fatigue has been defined as any exercise-induced reduction in the ability to exert muscle force or power, regardless of whether or not the task can be sustained. However, due to the potential clinical significance of ventilatory muscle fatigue, a more appropriate definition is a loss in the capacity for developing force and/or velocity of a muscle, resulting from muscle activity under load and which is reversible by rest. Although the techniques used in the assessment of diaphragm fatigue are indirect, there is sufficient evidence to suggest that the muscles of inspiration (primarily diaphragm) can be fatigued with high levels of ventilatory muscle work. For fatigue to occur, the diaphragm must sustain extremely high levels of force output and during heavy endurance exercise, the magnitude of fatigue and the likelihood of its occurrence increases as the relative intensity exceeds 85% of V̇O2max. Measurement of diaphragm fatigue is done by stimulating the phrenic nerves via electrical or magnetic stimulation while measuring the pressure difference between gastric and esophageal pressure (i.e., transdiaphragmatic pressure) before and after exercise. Several studies utilizing this technique in healthy individuals have shown that the diaphragm fatigues during heavy endurance-type exercise.
Does diaphragm fatigue influence V̇O2max and exercise performance? To test this hypothesis, cyclists performed time to exhaustion cycle exercise at 90% of V̇O2max work of breathing was increased or decreased by ventilatory muscle loading and unloading respectively. The increased work of breathing by ventilatory muscle loading caused a 15% reduction in time to exhaustion performance compared to controls. This detrimental effect on exercise performance was attributed to the associated reduction in leg blood flow, which enhances the onset of leg and also the intensity of leg and ventilatory muscle effort perceptions. When the ventilatory muscles were unloaded, there was a reduction in V̇O2 a reduced rate of change in dyspneic and limb discomfort sensations, and improvements in time to exhaustion performance by 14%. Exercise-induced diaphragmatic has important relevance to the athlete and causative mechanisms relate to interactions among the ventilatory muscles, the autonomic nervous system and the cardiovascular system.
Case Presentation Continued and Focus on Exercise Physiology Research
Question: why do you think that performance can be improved by removing diaphragm fatigue? What are the physiological mechanisms?
Chris’s coach is seeking a practical way to prevent or reduce diaphragm fatigue. There are commercially available devices which can be used to train the muscle of breathing. These so-called ventilatory muscle training devices have gained popularity and many athletes incorporate their use into their training regime. If we assume that the muscles of breathing can respond to a training stimulus like any other muscle (i.e., increased fibre size, capillarity, mitochondrial density etc.) it is possible that these changes could potentially reduce diaphragm and positively influence exercise performance. However, there remains controversy and debate within the scientific literature as to whether or not training the muscles of breathing can indeed improve performance. For an in depth perspective on this topic see Cross-Talk Debate (Ta and Mcconnell 2012; Patel et al. 2012).
Exercise-Induced Arterial Hypoxaemia (EIAH)
The level of oxygenation in arterial blood during exercise is defined by measures of PaO2, SaO2, and CaO2. Traditionally, all three measurements were thought to be maintained at all levels of exercise. However, an SaO2 of 3-15% below resting levels have been observed to occur at or near maximum exercise intensities. EIAH has been reported most frequently in fit young males, as sedentary males do not experience EIAH. It has been estimated that approximately 50% of very fit endurance athletes develop EIAH when exercising at sea level whereas untrained individuals do not. Studies of smaller numbers of fit females claim higher prevalence of EIAH and that it occurs at lower levels of V̇O2max than in young adult males. In our view, there is insufficient data to know the true prevalence of EIAH and the effects of fitness level or gender. Larger studies with direct blood gas measurements are required. Furthermore, it is not known if the mechanisms mediating EIAH are the same between men and women; nor is it known why some untrained (but healthy) women develop EIAH while their male counterparts do not.
What causes EIAH? Mechanisms to explain EIAH remain controversial. Pao2 is reduced below resting levels due to a widened alveolar-arterial O2 difference (AaDO2) and/or an insufficient increase in PAO2. Decreases in SaO2 are further exaggerated by a rightward shift of the HbO2 dissociation curve due to metabolic acidosis and increased temperature. An excessively widened AaDO2 during exercise is the most consistent contributor to EIAH. Hyperventilation in heavy exercise is a major compensatory mechanism—not only to minimize the degree of metabolic acidosis but also to prevent arterial hypoxemia. Thus this compensatory ventilatory response is often insufficient in the face of a widened AaDO2 and therefore contributes to EIAH. The precise causes of either of these deficiencies are not known but some promising mechanisms are currently under study. For example, exercise-induced ventilation-perfusion (V̇A/Q̇) inequality most likely contributes to a widened AaDO2; especially in view of the onset of EIAH during sub maximal exercise in some subjects. At least some of this proposed V̇A/Q̇ inequality may be due to the release of inflammatory mediators in the lung and their effects on the small airways and/or arterioles in the lung periphery. At maximum exercise, a diffusion limitation and perhaps even “stress-failure” of the alveolar-capillary interface remain plausible, but evidence for their existence is indirect in exercising humans. Recent studies imply that exercise-induced intrapulmonary arteriovenous shunting may play a role in EIAH but this has not yet been directly tested. This could simply be due to the fast transit time of the blood. The time needed for equilibration between alveolar and capillary blood PO2 is greater than the time that a drop of blood is in the capillary.
Does EIAH affect V̇O2max and exercise performance? Preventing O2 desaturation by having athletes breathe a mildly hyperoxic gas (FIO2: 26%) shows that there is a 1% drop in V˙ o2max for every 1% drop in SaO2 at any SaO2 beyond 92-93%. Although EIAH affects V̇O2max, it is important to recognize that an individual’s maximal aerobic capacity is simply one of many factors that influences endurance performance. Recent work in male subjects has shown that peripheral muscle during strenuous exercise is greater when arterial O2 content is reduced by breathing hypoxic gas versus normoxic and hyperoxic gases, lending support to the idea that gas exchange impairment may adversely influence exercise performance.
Summary
The primary purpose of the pulmonary system is to provide the body with oxygen and dispose of CO2. The oxygen cascade illustrates the pathway for oxygen delivery to the muscles. Partial pressure of O2 decreases as you move from ambient air (PO2=159 mm Hg) to alveolae (PO2 = 105 mm Hg), to arterial blood (PO2=98 mmHg to tissue (PO2 =2-40 mm Hg and venous blood (PO2=20-40 mmHg. Our ventilation responds during exercise by increasing quickly at the onset of exercise, and levelling off at a rate that is proportional to the exercise demand for O2. As exercise intensity approaches V̇O2max, ventilation increases disproportionately. This hyperventilation assists with buffering H+ by ridding the body of CO2. The control of ventilation is complex and includes both feedforward ad feedback mechanisms. Feedforward involves output from the motor cortex directly into the ventilatory control system. Feedback involves central and peripheral chemoreceptors and mechanoreceptors providing input to the ventilatory control system.
For most of us, our lungs are overbuilt for the demand that we can place on them; able to ventilate more than is needed even at maximal oxygen uptake. For highly trained athletes, however, this may not be the case. The inability to fully saturate arterial blood for those with exceptionally high V̇O2max is an indication that the lungs do not adapt to training.
Assignments
1. Using the terminology from this chapter, describe an example of the process by which the brain receives information from the body, process the information, and initiates changes in breathing. Place your example in the context of a real-world scenario.
2. Consider the idea of physiologic dead space. a) How does it differ from dead space? b) How is it calculated? c) How is physiologic dead space affected in a person with respiratory illness?
3. Using the categories discussed in this chapter, place the following muscles into the correct group of ventilatory muscles. Also, briefly touch on their function.
Nasal dilator muscles
External intercostals
Sternocleidomastoids
The genioglossus
Tensor muscles of the soft palate
Rectus abdominis
Scalenes
Internal and external oblique muscles
The diaphragm
Transversus abdominis
Internal intercostals
Geniohyoid
4. Describe how the ventilatory system meets the demands of rising minute ventilation during a) light, b) moderate, and c) intense exercise.
References
Aaron, E.A., Seow, K.C., Johnson, B.D., and Dempsey, J.A. 1992. Oxygen cost of exercise hyperpnea: implications for performance. J. Appl. Physiol. 72(5): 1818–1825. Available from www.physiology.org/journal/jappl [accessed 22 March 2019].
Ben-Tal, A., Shamailov, S.S., and Paton, J.F.R. 2012. Evaluating the physiological significance of sinus arrhythmia: looking beyond ventilation-perfusion efficiency. J. Physiol. 590(8): 1989–2008. doi:10.1113/jphysiol.2011.222422.
Dempsey, J., Sheel, A., Haverkamp, H., Babcock, M., and Harms, C. 2003. [The John Sutton Lecture: CSEP, 2002]. Can. J. Appl. Physiol. 28(Suppl: S2-24).
Dempsey JA. 1986. J.B. Wolffe Memorial Lecture: Is the lung built for exercise? Med. Sci. Sports Exerc. 18(2): 143–155. Available from http://run-fit.com/wp-content/uploads/isthelungbuiltforexercise.pdf [accessed 22 March 2019].
Dolyniuk, M. V, and Fahey, P.J. 1986. Relationship of tracheal size to maximal expiratory airflow and density dependence. J. Appl. Physiol. 60: 501–505. Available from www.physiology.org/journal/jappl [accessed 22 March 2019].
Eldridge, F.L., Millhorn, D.E., Killey, J.P., and Waldrop, T.G. 1985. Stimulation by central command of locomotion, respiration and circulation during exercise. Respir. Physiol. 59(3): 313–337. Elsevier. doi:10.1016/0034-5687(85)90136-7.
Harms, C.A., Babcock, M.A., McClaran, S.R., Pegelow, D.F., Nickele, G.A., Nelson, W.B., and Dempsey, J.A. 1997. Respiratory muscle work compromises leg blood flow during maximal exercise. J. Appl. Physiol. 82(5): 1573–1583. American Physiological SocietyBethesda, MD . doi:10.1152/jappl.1997.82.5.1573.
Johnson, B.D., Babcock, M.A., Suman, O.E., and Dempsey, J.A. 1993. Exercise-induced diaphragmatic in healthy humans. J. Physiol. 460: 385–405. Available from http://www.ncbi.nlm.nih.gov/pubmed/8487201 [accessed 22 March 2019].
Kaufman, M.P., and Forster, H. V. 2011. Reflexes Controlling Circulatory, Ventilatory and Airway Responses to Exercise. In Comprehensive Physiology. John Wiley & Sons, Inc., Hoboken, NJ, USA. doi:10.1002/cphy.cp120110.
Macklem, P.T. 2002. The Act of Breathing. In Mechanics of Breathing. Springer Milan, Milano. pp. 3–10. doi:10.1007/978-88-470-2916-3_1.
Mead, J. 1980. Dysanapsis in normal lungs assessed by the relationship between maximal flow, static recoil, and vital capacity. Am. Rev. Respir. Dis. 121(2): 339.
Miller, J.D., Pegelow, D.F., Jacques, A.J., and Dempsey, J.A. 2005a. Skeletal muscle pump versus respiratory muscle pump: modulation of venous return from the locomotor limb in humans. J. Physiol. 563(3): 925–943. John Wiley & Sons, Ltd (10.1111). doi:10.1113/jphysiol.2004.076422.
Miller, J.D., Pegelow, D.F., Jacques, A.J., and Dempsey, J.A. 2005b. Effects of augmented respiratory muscle pressure production on locomotor limb venous return during calf contraction exercise. J. Appl. Physiol. 99(5): 1802–1815. American Physiological Society. doi:10.1152/japplphysiol.00278.2005.
Pan, L.G., Forster, H. V, Bisgard, G.E., Murphy, C.L., and Lowry, T.F. 1986. Independence of exercise hyperpnea and acidosis during high-intensity exercise in ponies. J. Appl. Physiol. 60(3): 1016–24. doi:10.1152/jappl.1986.60.3.1016.
Patel, M.S., Hart, N., and Polkey, M.I. 2012. CrossTalk proposal: training the respiratory muscles does not improve exercise tolerance. J. Physiol. 590(15): 3393–5; discussion 3401. Wiley-Blackwell. doi:10.1113/jphysiol.2012.235408.
Phillipson, E.A., Bowes, G., Townsend, E.R., Duffin, J., and Cooper, J.D. 1981. Role of metabolic CO2 production in ventilatory response to steady-state exercise. J. Clin. Invest. 68(3): 768–74. American Society for Clinical Investigation. doi:10.1172/JCI110313.
Romer LM, Sheel AW, and Harms CA. The respiratory system. In: ACSM’s Advanced Exercise Physiology, edited by Farrell AP, Joyner MJ, and Caiozzo VJ. Philadelphia: Wolters Kluwer | Lippincott Williams & Wilkins, 2012, p. 242-296.
Sheel, A.W., Guenette, J.A., Yuan, R., Holy, L., Mayo, J.R., McWilliams, A.M., Lam, S., and Coxson, H.O. 2009. Evidence for dysanapsis using computed tomographic imaging of the airways in older ex-smokers. J. Appl. Physiol. 107(5): 1622–1628. doi:10.1152/japplphysiol.00562.2009.
Ta, O.S.S., and Mcconnell, A.K. 2012. CrossTalk opposing view: Respiratory muscle training does improve exercise tolerance. J Physiol 590: 3397–3398. doi:10.1113/jphysiol.2012.235572.
About the Authors
Glen E. Foster, School of Health and Exercise Science, The University of British Columbia – Okanagan

Dr. Foster completed his education at the University of British Columbia and University of Calgary. He is currently an Associate Professor in the School of Health and Exercise Sciences at the University of British Columbia’s Okanagan campus. In addition to undergraduate teaching and mentoring graduate students, Dr. Foster serves on the editorial board for several scientific journals in the area of exercise and environmental physiology.
Michael S. Koehle, School of Kinesiology, The University of British Columbia – Vancouver and Division of Sports Medicine, The University of British Columbia – Vancouver

Michael Koehle MD PhD, is the Director of Sport & Exercise Medicine at the University of British Columbia. He is a Professor in the both the School of Kinesiology and the Faculty of Medicine at UBC. His research focusses on the interaction between the human body and its environment, specifically how the body is affected by environmental stresses such as high altitude, heat, and air pollution. He practices Sport and Exercise Medicine at the UBC Sport & Exercise Medicine Centre and as a Physician for Athletics Canada.. His research program combines exercise and environmental physiology ranging from basic mechanistic research to clinical field studies in remote environments and applied research for high-performance sport.
Anne Lasinsky, School of Kinesiology, The University of British Columbia – Vancouver

Dr. Anne Lasinsky has received degrees from the Universities of Pittsburgh, Connecticut, and Pennsylvania followed by doctoral and postdoctoral training at the University of British Columbia (UBC) in Vancouver. She currently teaches courses and conducts research in the UBC School of Kinesiology.
A. William Sheel, School of Kinesiology, The University of British Columbia – Vancouver

Dr. Sheel (Bill) completed his education at Canadian institutions (University of New Brunswick, University of British Columbia) followed by postdoctoral training at the University of Wisconsin-Madison. He is currently a Professor in the School of Kinesiology and Adjunct Professor in the Faculty of Medicine at UBC. In addition to teaching undergraduate courses and supervising graduate students, he performs several editorial duties for scientific journals and is a Past Chair for the Canadian Society for Exercise Physiology (CSEP).
