
Chapter 20: High Altitude Physiology: Climbing Earth’s Highest Peak
Phil Ainslie and Joseph Donnelly

Photo 20-1 Mountain in Kananaskis (photo by Brian R. MacIntosh)
Learning Objectives
After reading this Chapter, you will:
- Describe the effect of high altitude on the oxygen cascade
- Describe the initial and prolonged effect of high altitude on respiratory, cardiovascular, and metabolic function
- Describe the limiting factors during exercise at high altitude
- Discuss pathophysiological effects of high altitude with respect to the central nervous and pulmonary systems
- Discuss the rationale behind training in the high-altitude environment
Key terms
barometric pressure, hypoxic ventilatory response, hypercapnic ventilatory response, hypoxic pulmonary vasoconstriction, Alveolar gas equation, alveolar ventilation, oxygen dissociation curve, peripheral chemoreceptors, central chemoreceptors, acid-base balance, Fick equation, ventilation perfusion mismatch, diffusion limitation, Fick principle, erythropoiesis, periodic breathing, acute mountain sickness, high altitude cerebral edema, high altitude pulmonary edema, acclimatization, adaptation.
—
Case Presentation: Rachel Takes a Sojurn
Through her success with cycling and her Kinesiology studies, it was always clear that Rachel had lofty ambitions. Consistent with this, after completing her second year of University, Rachel decided to try her hand at climbing with the ultimate goal of reaching the top of Mt Everest.
Although very fit from her athletics, she had not spent any time at high altitude and so decided to take a trip to the Nepal Himalaya, to undertake a 15-day trek to Everest Base Camp at around 5300m above sea level. In her summer break, she set aside one month for this trip. At around day 4 (3800m), Rachel – who normally can run very fast before getting puffed, found herself breathless, slowly trekking up a steady incline to the Tengboche monastery. As she continued to trek towards the base of Mt Everest, she noticed many further changes to her body: her resting heart rate was increased; her ability to run was decreased; and her sleep was less restful.
Three days after huffing and puffing her way up to the monastery, Rachel is delighted to reach the mighty Khumbu glacier and Everest base camp. She is interested to find a group of physiologists performing research up at basecamp and quickly volunteers for their studies. She performed various exercise, respiratory, vascular, and blood tests for these researchers.
The next morning, she woke up feeling like she hadn’t even been to sleep and began to feel a little bit nauseous. Over the course of the day, her nausea worsened, and she started to develop a headache. By lunch time, Rachel was in a bad state; she didn’t even feel like eating her beloved Nepali momo’s! Her headache was pounding, she had lost her appetite, and felt like she had no energy.
At this stage, a knowledgeable Sherpa recognized these features as being consistent with Acute Mountain Sickness (AMS). An expedition doctor, resident at Everest base camp, examined Rachel and found a heart rate of 100 b∙min-1, BP 120/80 mmHg and a peripheral capillary O2 saturation (SpO2) of 80%. Her lungs were clear to auscultation and despite feeling sick, Rachel was still fully alert. The doctor confirmed the clinical diagnosis of AMS and knowing that the most effective treatment for AMS is to descend to a lower altitude, he advised trekking down with her Sherpa to a village 1000m lower.
—
Introduction
Over 400 years ago (1650 AD), Blaise Pascal persuaded his brother-in-law to carry the newly invented mercury barometer to the top of a mountain in central France. In doing so, the pair discovered that barometric pressure (derived from the Greek words Baros meaning ‘weight’, and metron meaning ‘measure’) decreased with increasing altitude. 300 years ago, the composition of the air and the critical importance of oxygen were discovered (Lavoisier 1777). Therefore, it may seem surprising that it was not until 200 years ago that the early balloonists fatally unearthed the disturbing, yet seemingly obvious, truth; ascent to high altitudes can place an enormous stress on the human body – even to the point of causing death (see Table 20-1).
Table 20-1 Ten important discoveries in high altitude physiology
|
Date |
Discoverer |
Discovery |
|
|
1644 |
Torricelli |
Invented the mercury barometer |
|
|
1648 |
Pascal |
Pressure decreases with increasing altitude |
|
|
1777 |
Lavoisier |
Discovery of oxygen |
|
|
1875 |
Tissandier |
Zenith balloon mission |
|
|
1878 |
Paul Bert |
The publication ‘barometric pressure‘ describing, for the first time, the oxygen and carbon dioxide dissociation curves for haemoglobin |
|
|
1911 |
Douglas and Haldane |
Pikes peak expedition showed the increase in ventilation with hypoxia |
|
|
1913 |
T. H Ravenhill |
Publishes ‘Some Experiences of Mountain Sickness in the Andes’ in which he describes mountain sickness including pulmonary and cerebral subclassifications |
|
|
1944 |
Houston and Riley |
Operation Everest 1: showed that it is possible to survive at the barometric pressure of the summit of Everest |
|
|
1953 |
Tenzing and Hillary |
First ascent of Mt Everest |
|
|
1978 |
Messner and Habeler |
First ascent of Mt Everest without supplemental oxygen |
|
Subsequent work identified factors other than altitude that can influence barometric pressure including latitude (with higher pressures near the equator), season, temperature, and humidity. Altitude, however, has by far the greatest influence on barometric pressure and the relationships between altitude, barometric pressure, and inspired oxygen pressure are shown in Figure 20-1.
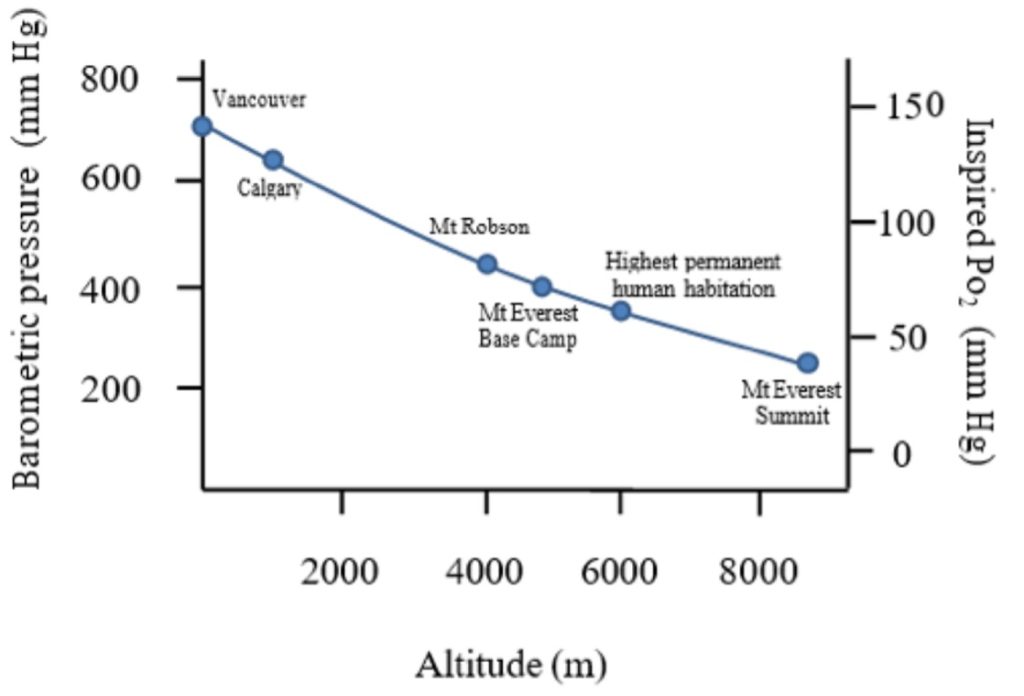
This causal chain (increased altitude decreased barometric pressure decreased inspired oxygen pressure) forms the basis for understanding the effects of altitude on the human body. In this chapter we will explore the respiratory, cardiovascular, muscular, haematologic, and neurologic responses to altitude.
Respiratory Response
At sea level, barometric pressure (PB) of the air is approximately 760 mm Hg (Figure 20-1). When this air is inspired into the human airways, it is warmed and moistened with water such that the inspired pressure is 47 mm Hg lower than barometric pressure. The fraction of this inspired air that is oxygen is about 0.2094. Therefore, the pressure of oxygen inspired is given by the product of the fraction of oxygen and the dry inspired air pressure.
This is shown in equation 20-1:
PI O2= (PB – P H2O )∙FIO2 Equation 20-1
Where, PIO2 = partial pressure of inspired oxygen; PB = barometric pressure;- PH2O = water vapour pressure; FIO2 = fraction of inspired oxygen.
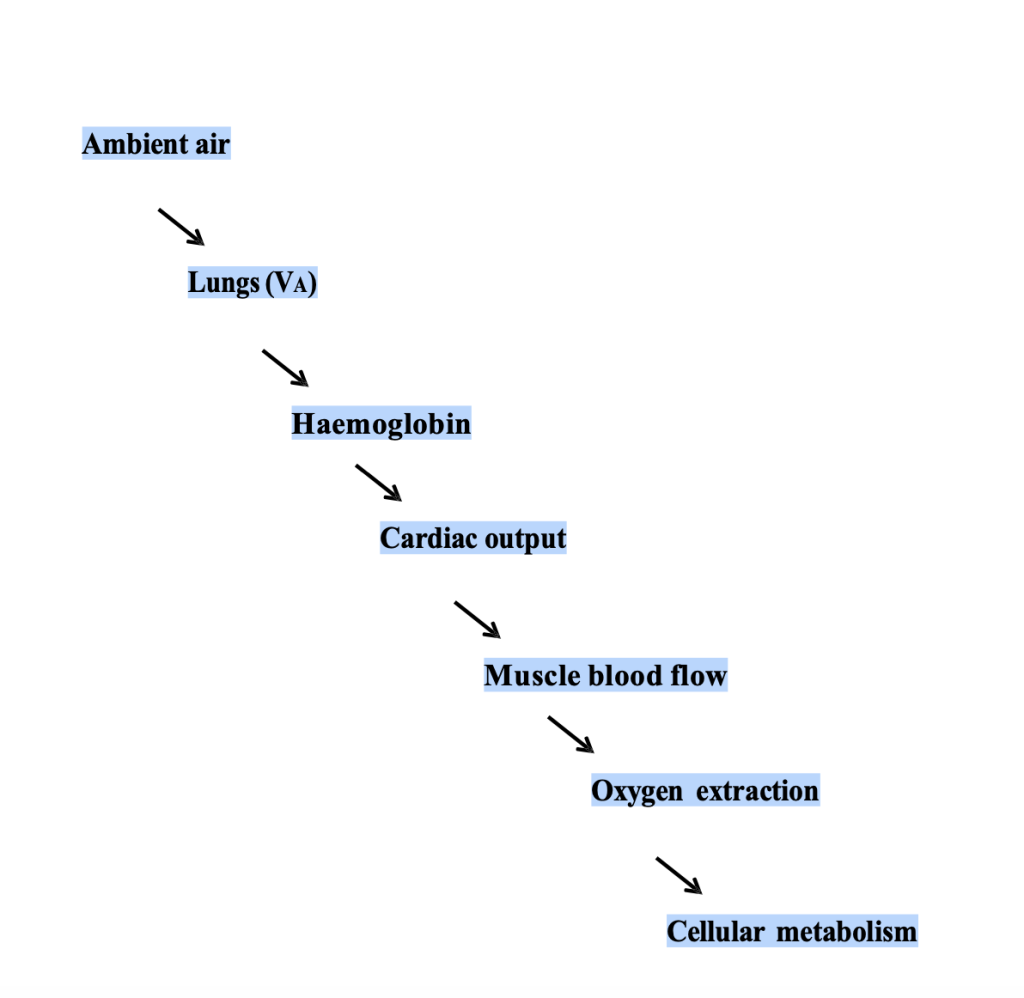
When we ascend to altitude, our inspired oxygen pressures (PIO2) decrease on account of the decreased barometric pressure. The water vapour pressure and the fraction of oxygen in the air are, however, constant across altitudes for a given relative humidity. The journey of oxygen molecules from the ambient air to where they are finally used is long and arduous. This path that oxygen must follow is known as the oxygen cascade and can be used as a framework to help understand the effects of high altitude on the respiratory, cardiovascular, and haematologic systems and how they respond during exercise.
Oxygen cascade
Let us consider our friend, Rachel. Before embarking on her trek, at UBC Vancouver (sea level) her PIO2 is approximately 150 mm Hg (Figure 20-2). Her alveolar PO2 is considerably lower than this and is determined by the balance of oxygen removal by pulmonary capillaries and oxygen replenishment by ventilation. At sea level and with resting ventilation, her alveolar PO2 is approximately 100 mm Hg; giving a drop from the pharynx to the alveoli of 50 mm Hg. Between her alveolae and the pulmonary blood there is a further decrease of approximately 5-10 mm Hg owing to V̇:Q̇ mismatch, imperfect diffusion, and some shunt. Across the tissues the PO2 drops further according to the oxygen uptake of the specific tissues.
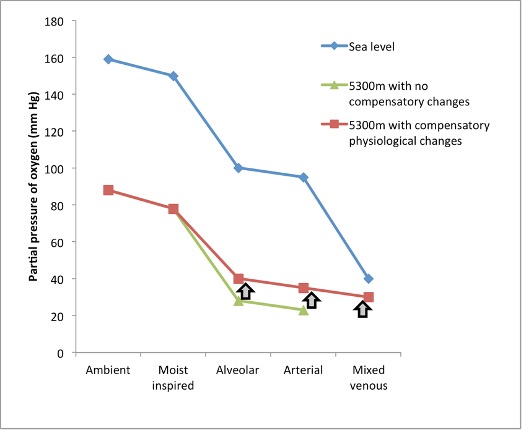
The situation at altitude is, however, different. For example, when Rachel is up at Everest base camp (~5300m); the barometric pressure is 420mm Hg, which yields a PIO2 of 78 mm Hg. Let us now consider the hypothetical situation that would occur if Rachel had no respiratory, cardiovascular, or haematologic changes. In this hypothetical situation, the difference between inspired and alveolar PO2 (determined by the balance between ventilation and pulmonary O2 uptake) would not change from sea level (50 mm Hg), giving an alveolar PO2 of 28 mm Hg and hence an arterial PO2 of ~ 23 mm Hg, a remarkably low value that is probably incompatible with life. Luckily for Rachel, her body does respond to this reduced oxygen environment with significant respiratory, cardiovascular, and haematologic changes that make life at this altitude possible. We will now consider each step along the oxygen cascade in a little more detail.
Inspired to Alveolar Partial Pressure of Oxygen
As one might have guessed, the respiratory system responds to the decrease in oxygen levels at high altitude with an increase in ventilation. This increase in ventilation acts to increase the pressure of oxygen in the alveoli. When we increase ventilation, however, it is not only the oxygen levels in the alveoli that change; an increase in ventilation causes a decrease in alveolar CO2 pressure (PACO2).
Because nearly all the CO2 at the end of expiration is due to the body’s production of CO2 (i.e, the contribution of inspired ambient CO2 can be ignored), the amount of CO2 that is removed (or produced) by the body will be equal to the ventilation multiplied by the fraction of CO2 in the exhaled breath. This fraction of CO2 can be converted to a pressure by way of a conversion factor K:
Rearranged, this gives the ventilation equation.
PACO2 = V̇CO2∙V̇A -1∙K Equation 20-2b
Where PACO2, is the alveolar PCO2, V̇CO2 is the body production of CO2 in L⋅min-1 (normally ~ 200 ml/min at rest), V̇A is alveolar ventilation in L⋅min-1 (equal to the total ventilation minus the dead space ventilation; see chapter 7 and K is a constant (0.863) necessary to equate dissimilar units for V̇CO2 (ml⋅min-1) and V̇A (L∙min-1) to PACO2 pressure units (mm Hg). The ventilation equation is useful to us, because it highlights the inverse relation between PACO2 and V̇A; a doubling of ventilation will halve the alveolar PCO2 or halving the V̇A will double the PACO2.
How does an increase in ventilation affect alveolar O2 pressure? Intuitively, the alveolar PO2 will depend upon the pressure of inspired O2. Alveolar will also depend on the ventilation; the higher the ventilation, the more oxygen there will be in the alveoli. Because we have already seen that ventilation is inversely proportional to PACO2, we can appreciate that the lower the PaCO2, the higher the alveolar PO2 will be. Thus, alveolar PO2 is directly proportional to the PIO2 and inversely proportional to the PCO2.
Because the relationship between and CO2 production is not 1 (i.e for each mole of oxygen consumed, approximately 0.8 moles of CO2 is produced – the respiratory exchange ratio, R), we cannot simply assume that the decrease in PaCO2, with an increase in ventilation will equal the increase in PaO2. The rise in PO2 in the alveolar gas with an increase in ventilation will be greater (in accordance with the respiratory exchange ratio) than the decrease in PCO2 in the alveolar gas. These relations can be summarized in the alveolar gas equation:
PAO2 = PIO2 – PACO2⋅R-1 +F Equation 20-3a
Where F is a correction factor usually equal to about 2 mm Hg and can therefore be ignored.
We observed before that if no physiological adaptation took place with high altitude, on exposure to 5300m, Rachel’s alveolar PO2 would drop to ~28 mm Hg; an extremely low and dangerous value. However, Rachel’s ventilation at 5300m would be expected to increase by ~75% (i.e. from 10 L⋅min-1 to 17.5 L⋅min-1), which according to the ventilation equation would result in alveolar PCO2 of approximately ~25 mm Hg (assuming no change in CO2 production).
PAO2 = PIO2 – PaCO2 ⋅R-1 Equation 20-3b
PAO2= 78-25/0.8 = 46.75 mm Hg
Using this example of Rachel, with and without hyperventilation, we can see that hyperventilation increases alveolar PO2 by approximately 12 mm Hg (28-40 mm Hg), making it possible for humans to live at high altitude. The increase in ventilation with high altitude exposure is obviously a very important means for increasing the oxygen pressure in the blood and indeed represents probably the most important adaptation to the high-altitude environment in the acute setting. The increase in oxygen pressure by this hyperventilation increases the binding of oxygen to haemoglobin in accordance with the oxygen dissociation curve. This is discussed further below. The mechanisms controlling this increase in ventilation will be also discussed later in this chapter.
Alveolar to Arterial PO2
We saw above that Rachel’s alveolar PO2 at 5300m is ~42 mm Hg, and this drops to about 35 mm Hg in the arterial blood. Before considering the reason for the drop in PO2 between the alveoli and the arterial blood, we will review the anatomy of this junction.
Between the alveolar spaces and the pulmonary capillaries is an exceedingly thin space over which oxygen is transferred to the blood and carbon dioxide is transferred to the alveolar space. Diffusion across this barrier was described in chapter 7 and is affected by many different variables as dictated by Fick’s law of diffusion. Diffusion of gas across a membrane is directly proportional to the tissue area of exposure (A), the pressure gradient across the membrane (P1-P2), and the diffusion constant for the particular gas (D) and is inversely proportional to the thickness of the membrane (T). The diffusion constant is in turn directly proportional to the solubility of the gas and inversely proportional to the square root of the molecular weight of the gas.
These relations can be summarized in the following 2 equations:
Vgas = (A/T)∙D∙(P1-P2) Equation 20-4a
D = sol ⋅MW Equation 20-5
The diffusion constant for CO2 is considerably higher than for O2, meaning that diffusion limitation of CO2 is not a problem in humans. The diffusion constant for CO2 is much greater than O2 owing to its far greater solubility in tissues.
Because it is usually not possible to measure the surface area and thickness of the alveolar capillary membrane in humans, the equation is often rewritten as
Vgas= DL (P1-P2) Equation 20-4b
Where DL combines the factors of surface area, thickness, and diffusion constant.
Therefore, it can be appreciated that: thickening of the alveolar capillary membrane, decreased surface area for diffusion, or a decrease in pressure gradient across the membrane could contribute to a decrease in pulmonary gas exchange.
In addition to properties of the alveolar-capillary interface, it has been shown that diffusion will depend upon how easily molecules through the pulmonary capillary blood and how avidly the red blood cells and haemoglobin molecules will take up oxygen. In situations where a haemoglobin molecule has a very high affinity for O2 (i.e at high altitude on the steep portion of the oxygen dissociation curve), diffusion of oxygen across the alveolar-capillary membrane becomes rate limiting in a process known as ‘diffusion limitation.’ This diffusion limitation is especially apparent during exercise at high altitude (see below).
This diffusion limitation can be shown by modelling the uptake of oxygen in the red blood cells transiting the alveolar-capillary interface (Figure 20-3). It can be appreciated that at sea level, by the time the red blood cells reach approximately 1/3 of the way across the capillary, the PO2 is about equal to the alveolar value (~100 mm Hg). At high altitude, there are three factors that contribute to a lack of equilibration between alveolar and pulmonary capillaary PO2. These are: the decreased driving force (P1-P2), reduced transit time due to increased cardiac output and the high affinity of haemoglobin for oxygen (steep part of oxygen dissociation curve). The PO2 in the capillary blood never reaches that of the alveolus, even at the end of transit.
![A drawing over a graph illustrates an alveolar space, represented by a dome with an airway attached and a capillary across the bottom. The graph illustrates the change in PO2 as blood moves through the capillary. The axis on the left shows capillary PO2 in mm Hg. The x axis shows capillary transit time from zero to 0.75 s. A solid line representing rest at sea level shows a rapid rise in PO2 from below 50 mm Hg to nearly 100 mm Hg, reaching this peak by about .25 of the distance through the capillary. Another solid line representing rest at 5000 m shows a slower increase in PO2, from below 25 mm Hg to about 48 mm Hg, reaching the peak before half way through the capillary. During exercise, shown with dashed lines, PO2 increases from below 50 mm Hg to just below 100 mm Hg at sea level. This upper value is achieved a little slower than at rest, but still before 0.5 of the way through the capillary. At altitude, the dashed line representing exeer]cise increases slowly from below 25 mm Hg to about 36 mm Hg, well below the level achieved at rest.](https://pressbooks.openeducationalberta.ca/app/uploads/sites/228/2023/03/Fig20-3.jpg)
Other factors thought to contribute to widening of the Alveolar arterial gradient at high altitude are ventilation perfusion mismatch (caused by sub clinical pulmonary edema; see below) and opening of intra pulmonary shunts.
Arterial to Mixed Venous PO2 Difference
The difference between the arterial and venous PO2 is the final step in the oxygen cascade and is due to the extraction of oxygen from the systemic capillaries. This extraction of oxygen is dependent upon cardiac output, the metabolic rate, and the oxygen carrying capacity of the blood. The mixed venous PO2 is strictly defined as the PO2 in the blood draining all systemic tissues including the myocardium and is therefore measured in the pulmonary artery. It can be viewed as the average tissue oxygenation throughout the whole body and as such all the compensatory adaptations at altitude act to increase Pv̅O2 towards sea level values.
The uptake of oxygen by a given tissue (V̇O2 in ml∙min-1) can be defined as the product of two variables:
- the difference in oxygen content between the arterial blood supplying the tissue and the venous blood draining the tissue
- the blood flow through the tissue. When the body is considered as a whole, blood flow through the tissue is the cardiac output.
- Pv̅O2
This relation is known as the Fick principle and can be defined as:
Where V̇O2 is in mL∙min-1; C(a-v̅)O2 is the difference in oxygen content between arterial and mixed venous blood, and Q̇ is the cardiac output.
This can be rearranged to:
C(a-v̅)O2 = V̇O2 ∙Q̇–1 Equation 20-6b
And because CaO2 is related to [Hb] and (via the oxygen dissociation curve; denoted by a factor – k) to PO2 this can be further rearranged to:
(a-v̅)PO2∙[Hb]∙k = V̇O2∙Q̇-1 Equation 20-6c
And
(a-v̅)PO2 = V̇O2∙Q̇-1∙(k [Hb])-1 Equation 20-6d
Therefore it can be appreciated that the difference between the arterial and venous PO2 at high altitude is directly proportional to the metabolic rate of the tissues, and inversely proportional to the cardiac output and [Hb].
At high altitude, Rachel’s resting V̇O2 is approximately 250 ml∙min-1, approximately equal to that at sea level. Her resting cardiac output and [Hb] are both increased. The net effect is that Rachel’s A-v̅PO2 at high altitude is decreased. During exercise the V̇O2 of the muscles and the whole body are increased leading to an increase in A-v̅PO2. The cardiovascular response to exercise will be discussed after the control of ventilation is considered.
Control of Ventilation at High Altitude
Central Chemoreceptors
As reviewed in chapter 7, the control of breathing at rest involves detection of oxygen and carbon dioxide levels in the body by sensors, a relaying of this signal to the central controller in the brainstem, and efferent output from this central controller to the muscles of respiration.
At sea level, the main chemical controller of breathing is the partial pressure of CO2. This CO2 acts indirectly via H+ ion at mainly the central chemoreceptor in the medulla but also at the peripheral chemoreceptor at the carotid body.
The central chemoreceptors are a group of neurons that lie in the medulla and respond to changes in hydrogen ion concentration in the surrounding extracellular fluid (ECF) to bring about a change in ventilation. An increase in H+ concentration stimulates breathing whilst a decrease inhibits breathing. Because the blood brain barrier is relatively impermeable to hydrogen ions, the major contributor to brain ECF hydrogen ion concentration in the arterial blood is PCO2 (not H+) that diffuses into the brain ECF is hydrated to carbonic acid and then to H+ ions that stimulate the central chemoreceptors to increase ventilation.
The sensitivity of the body to changes in CO2 can be determined experimentally by increasing the pressure of CO2 in the arterial blood (i.e. by breathing a 5% CO2 gas mixture) and measuring the resultant increase in ventilation using a spirometer.
Ventilatory CO2 sensitivity = ΔV̇E ⋅ ΔPaCO2-1 Equation 20-7
Where
When the ventilation is measured at multiple levels of arterial PaCO2, a hypercapnic ventilatory response curve (HCVR) can be constructed as shown on Figure 20-4.
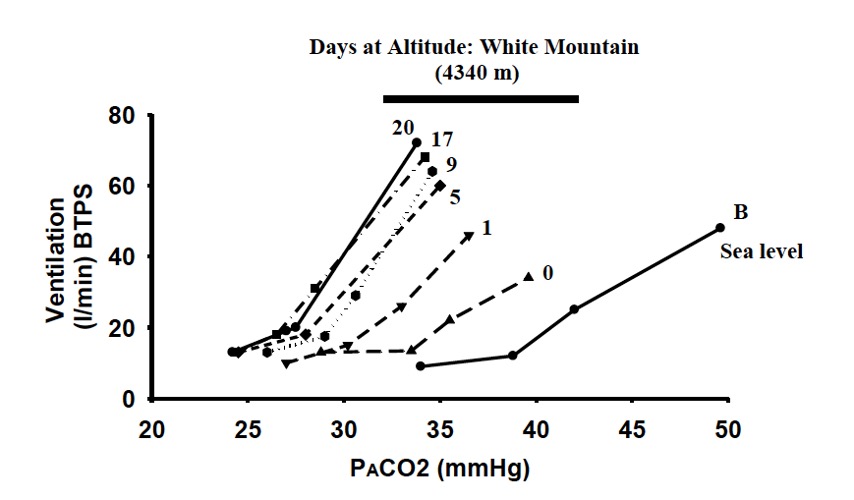
At high altitude, the ventilatory CO2 sensitivity is increased leading to a steepening of the HCVR. In addition, the PaCO2, at which ventilation will be stimulated is decreased resulting in a leftward shift in the HCVR (Fan and Burgess et al., 2010). Because the ventilatory response to CO2 is predominantly at the central chemoreceptors (rather than the peripheral chemoreceptors; see chapter 10 on control of breathing), we can conclude that at high altitude the central chemoreceptors are more sensitive to changes in PCO2 and will increase ventilation at lower levels of CO2. Potential mechanisms explaining this ‘resetting’ of the HCVR are still under debate.
Peripheral Chemoreceptors
The peripheral chemoreceptors lie in the carotid sinus and aortic body. These receptors are highly vascular and respond rapidly to changes in oxygen partial pressure but also to a lesser degree, to changes H+ and CO2.
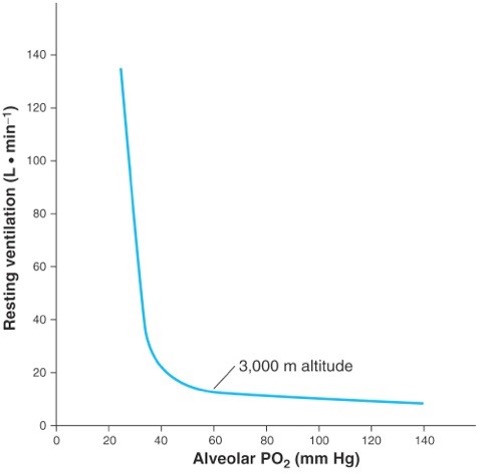
When exposed to low levels of ambient oxygen partial pressure, ventilation increases by a process known as the hypoxic ventilatory response (see Figure 20-5). From Figure 20-5 it can be seen that the ventilatory response to hypoxia is not linear; between alveolar partial pressures of oxygen of 500 and 50 mm Hg, the ventilatory response is relatively stable with only a minor increase in ventilation., whereas, below an alveolar PO2 of 50 mm Hg ventilation increases steeply, especially if alveolar PCO2 is held constant. Interestingly, 50 mm Hg lies at the point on the oxygen dissociation curve where saturation begins to fall steeply, and therefore the steepening of the hypoxic ventilatory response can be seen as a mechanism that attempts to keep the PO2 on to the flat portion of the oxygen dissociation curve.
Integrated Ventilatory Response to High Altitude
Acute exposure to high altitude results in a decrease in alveolar PO2 and therefore arterial partial pressure of oxygen as described above. This decrease in partial pressure of oxygen results in stimulation of the peripheral chemoreceptors (predominantly at the carotid sinus) with a resultant increase in ventilation. This initial increase in ventilation (the hypoxic ventilatory response) decreases PCO2 and increases PO2 in the alveolar gas according to the ventilation and gas equations.
The decrease in arterial PCO2 (and consequent increase in arterial – respiratory alkalosis) acts to inhibit the peripheral chemoreceptor. In addition, because CO2 is freely diffusible across the blood brain barrier, a decrease in cerebral spinal fluid (CSF) CO2 occurs, thus raising CSF and brain ECF. causing inhibition at the central chemoreceptors. Both of these effects act to return ventilation back towards sea level values.
However, over a period of hours to days at high altitude the body compensates for the respiratory alkalosis by increasing bicarbonate excretion in the kidney and increasing bicarbonate removal from the ECF by the choroid plexus. Thus the inhibition at the central and peripheral chemoreceptors is removed and the ventilation once again increases.
Cardiovascular response
Along with the respiratory changes described above, the cardiovascular system reacts and adapts to the high-altitude environment. The cardiovascular response is important as it acts to transport the oxygen from the pulmonary capillaries to the systemic capillaries of the target tissues and from the discussion of the oxygen cascade above, cardiovascular variables determine the drop in PO2 from the arterial to the venous blood. Three major cardiovascular variables will be considered below: cardiac output and its constituents (heart rate and stroke volume), pulmonary pressures, and mean arterial pressures.
Cardiac Output
One of the things that Rachel noticed when she was at high altitude was that her resting heart rate, which was usually around 45 beats per minute, had increased to about 70 beats per minute. This increase in heart rate results in an increased cardiac output (because stroke volume is unaffected by acute hypoxia). Increased cardiac output is useful because it maintains oxygen delivery in the face of a decreased arterial PO2. The increase in heart rate is mediated through an increase in sympathetic outflow resulting from hypoxic stimulation of the peripheral chemoreceptors.
With chronic exposure to high altitude, cardiac beta adrenoceptors down-regulate resulting in a decrease in resting HR back towards, but never reaching, sea level values.
Stroke volume is consistently decreased with chronic exposure to high altitude. A decrease in stroke volume can be caused by either a decrease in contractile ability (increased end systolic volume), or a decrease in ventricular filling (decreased end diastolic volume). Evidence from echocardiographic studies have confirmed that at high altitude, there are no changes in end- systolic volume (contractile ability) and a consistent decrease in end-diastolic volume (ventricular filling).
A decrease in end diastolic volume at altitude can be accounted for by a decrease in plasma volume (as discussed below) and subsequent decrease in ventricular filling. Another factor contributing to the decrease in left ventricular end diastolic volume at high altitude could be right ventricular dilation and subsequent impaired filling of the left ventricle.
The net result of these changes is that cardiac output decreases back towards sea level values with time at altitude.
Systemic Blood Pressure
Mean arterial pressure is the product of cardiac output and total peripheral resistance. We have already seen that at rest, cardiac output is increased during both acute and chronic hypoxia, in a process. To understand the effect of hypoxia on MAP we will also need to consider the effect of hypoxia on the contractile state of the blood vessels – the total peripheral resistance.
Hypoxia stimulates peripheral chemoreceptors , which in turn increases sympathetic neural activity. This increase in sympathetic nervous activity would normally lead to norepinephrine release in the walls of systemic arterioles and constrictive effect. However, reduced oxygen content in the blood causes arteriolar dilation. The balance between these dilator and constrictor forces determines the total peripheral resistance. For example, if local reduced oxygen content and dilation outweighs sympathetically mediated constriction, then a decreased total peripheral resistance will result. If on the other hand, the sympathetically mediated constriction outweighs the local reduced oxygen content mediated dilation, then an increase in total peripheral resistance will occur.
Acute exposure to high altitude causes a decrease in total peripheral resistance and increase in cardiac output leading to a slightly decreased mean arterial pressure. Chronic exposure to high altitude leads to an increase in total peripheral resistance and an increase in cardiac output (compared to sea level), leading to an increase in mean arterial pressure.
These effects are summarized in Table 20-2.
Table 20-2 Cardiovascular variables at high altitude
|
|
Sea level |
Acute Exposure to 5000m |
Chronic Exposure to 5000m |
|
HR (bpm) |
70 |
80 |
75 |
|
SV (mL) |
70 |
70 |
60 |
|
Cardiac output (L∙min-1) |
5 |
5.6 |
5.2 |
|
MAP (mm Hg) |
100 |
95 |
110 |
|
RAP (mm Hg) |
5 |
5 |
5 |
|
TPR (mm Hg∙L-1∙min-1) |
20 |
16 |
20 |
|
Pulmonary pressure mean (mm Hg) |
10 |
20 |
25 |
|
PVR (mm Hg∙L-1∙min-1) |
2 |
3 |
3.5 |
Pulmonary Pressure
The most striking change in the cardiovascular system is probably the increase in pulmonary artery pressure. This increase in pressure is caused by alveolar hypoxia in a process called vasoconstriction (HPV).
Analogous to in the systemic arteries, mean arterial pressure is determined by the product of the right ventricular cardiac output and the peripheral resistance of the pulmonary system. Therefore, to understand the changes in pulmonary arterial pressure, we need to consider the changes to the pulmonary vascular resistance, and the cardiac output. As discussed above, cardiac output increases with acute high-altitude exposure, and then decreases to a level still above sea level values. Interestingly, in response to alveolar hypoxia the pulmonary vessels constrict causing an increase in pulmonary vascular resistance. As a result of both the increase in cardiac output and pulmonary vascular resistance, high altitude causes an increase in mean pulmonary arterial pressure.
This HPV in many situations can be seen as a beneficial physiological response because it can act to increase ventilation-perfusion matching. Alveoli that are poorly ventilated will be relatively hypoxic and therefore the adjacent pulmonary vasculature will constrict, meaning that less blood flow is through poorly ventilated alveoli and more blood flow will be redirected towards the better ventilated alveoli (those units with no alveolar hypoxia).
Another example where hypoxic pulmonary vasoconstriction response is imperative is in the transition of the fetal circulation to life outside the uterus. In utero, the function of gas exchange is provided by the placenta and as such the lungs are non-functional. Oxygenated blood is diverted from going through the lungs via the combined action of hypoxic pulmonary vasoconstriction and a patent ductus arteriosus (a conduit between the pulmonary artery and the aortic arch). When the baby takes its first breath, the alveoli are filled with oxygen rich air, hypoxic pulmonary vasoconstriction is released allowing for essential pulmonary blood flow and thus gas exchange.
Unlike the situations of local hypoxia and transition of the fetal to neonatal circulation, during the situation of high altitude the response is largely deleterious. With hypoxia in all alveolar- capillary units, widespread vasoconstriction occurs resulting in an increase in pulmonary artery pressure. If the increase in pulmonary artery pressure is too great, stress induced damage to the pulmonary vessels may occur leading to the condition high altitude pulmonary edema. If this increased pulmonary artery pressure is sustained, it can cause right ventricular failure with significant morbidity and mortality.
Highlight box- How long until Everest is ‘unclimbable’ without supplemental oxygen?
The Italian climber, the Duke of Abruzzi, at the turn of the last century completed an “oxygenless” ascent to 7500 m in the Karakoram despite ominous predictions by the British Alpine Club, “ . . .21 500 ft (6553 m) is near the limit at which man ceases to be capable of slightest further exertion” (West, 1998). Naturally, it was not long before attention turned towards Mt Everest, which in 1892 had been declared the highest mountain in the world. Mountaineers were irrevocably drawn to the ultimate challenge, and, in 1924, Edward Norton (1884–1954) ascended to within 300 m of its summit without supplementary O2, a remarkable feat eclipsed by the untimely deaths of George Mallory and Andrew Irvine some two days later. These courageous attempts motivated a series of pioneering studies by Rodolfo Margaria (1901– 1983) and Joseph Barcroft (1872–1947), who subsequently concluded that an oxygenless ascent of Mt Everest would not be possible (Barcroft and Douglas et al., 1931). However, the legendary ascent by Reinhold Messner and Peter Habeler in 1978 overcame these previous negative predictions; the last 3% of Mt Everest had finally been conquered 54 years after Norton’s initial bid, having claimed no fewer than 39 lives in the process. Messner’s quote on reaching the top clearly establishes that the summit of Mt Everest was tantalizingly close to the limits of human tolerance, “. . .Now, after the hours of torment . . . I have nothing more to do than breathe . . .I am nothing more than a single, narrow, gasping lung, floating over the mists and the summits.” (Messner, 1979). By 1986, Messner had confirmed his place in mountaineering history having climbed all 14 of the 8000 m peaks without supplementary O2.
Seasonal variations in barometric pressure at these extreme altitudes have a major impact on systemic O2 transport and are thus of considerable physiological significance. Previous theoretical calculations have identified that a mere 4 mm Hg decrease in summit barometric pressure would reduce a climber’s predicted V̇O2max by about 10%. These small but critical reductions in PO2 likely reflect why Everest was only summited without oxygen some 25 years after its first ‘summer’ ascent, a remarkable feat that was achieved on 22 December 1987 by Sherpa, Ang Rita.
The physiological significance of these achievements came to light in the early 1980’s when two landmark studies (West and Boyer et al., 1983; Sutton and Reeves et al., 1988) measured the
Messner’s total body mass including equipment was reported to be 74 kg, which at an ascent rate of 2 m⋅min-1 during the last 100 m of the climb would have resulted in a output close to 150 kg∙m-1∙min-1. Estimations suggest that a submaximal effort would have required a V̇O2max of approximately 3.5 METs (1 MET = 3.5 ml∙kg-1∙min-1) (West and Wagner, 1980). Assuming a constant growth rate of 3 cm∙year-1 and (2011) height of 8868.92 m, a climber with a V̇O2max of 3.5 METs would therefore have to make their assault on the summit during the summer months before about 39 460 AD. A winter ascent would need to be launched before 29 107 AD. By about 104 167 AD, a climber’s V̇O2max on the summit would equate to their basal metabolic rate measured at sea level, emphasizing the futility of any summit bid!
High Altitude Illness: Acute Mountain Sickness, and High-Altitude Cerebral Edema
Acute Mountain Sickness
In the case presentation, Rachel became progressively more ill about 12 hours after arriving at Everest base camp. Her predominant symptoms were headache, malaise, decreased appetite, and nausea. These constitute the classic symptoms of acute mountain sickness. Even despite being in excellent physical condition (V̇O2max = 62 ml∙kg-1∙min-1), and taking a slow and careful ascent profile, she developed these distressing symptoms. Her experienced Sherpa guide quickly recognized what was going on and the mountain doctor prescribed the most effective and simple treatment, immediate descent.
Acute mountain sickness (AMS) is a self-limiting condition affecting a large proportion of previously healthy men and women who ascend to high altitude. The incidence depends upon both the absolute altitude and the rate of ascent such that below an altitude of 2000m, AMS is rare, and above 5000m, AMS is almost universal. Because the rate of ascent is an important factor, AMS is particularly an issue in places where rapid ascent to high altitude by aircraft, cable car, or railway is possible such as at ski resorts and some villages in South America and the Himalaya.
Early reports of the altitude related illness date back centuries, but a clear report of the illness was not documented until the British Doctor, TH Ravenhill in the early 20th century, published his observations of illness in a high-altitude population. As a medical officer serving in a Chilean high-altitude mining company, he observed an illness of headache and tiredness, which he correctly attributed to altitude.
CLINICAL FEATURES:
The predominant symptom of AMS is a headache and indeed the current diagnostic criteria requires a headache to be present for the diagnosis to be made. Other symptoms include anorexia, malaise, nausea, vomiting, and sleep disturbance. The onset of symptoms normally occurs at approximately half a day after ascent to a high altitude and persists for no more than 5 days. Physical examination may be unremarkable, however, fever, inspiratory crackles, and low SpO2 may be present.
PREDISPOSING FACTORS:
Although AMS is nearly universal if ascent is sufficiently rapid, and altitude is sufficiently high, there are a number of other factors that make AMS more likely. Factors making AMS more likely are: previous AMS, low oxygen saturations, blunted hypoxic ventilatory response, and exercise (Richalet and Larmignat et al.,(2012). Factors with no apparent effect on AMS include aging, V̇O2max and hypoxic pulmonary vasoconstriction response.
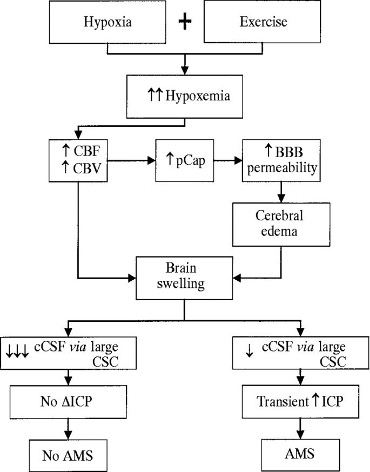
MECHANISMS OF AMS:
The mechanisms underlying AMS are related to hypoxia but the fact that symptoms do not occur immediately (in contrast to the hypoxia, which occurs immediately) indicates that hypoxia initiates a series of events that ultimately result in AMS. Proposed mechanisms include fluid retention, increased microvascular permeability, and raised intracranial pressures (Figure 20-6).
PREVENTION AND TREATMENT:
Prevention of AMS typically involves a slow, graded ascent to high altitude. General advice includes that when above 3000m, each night should be spent no more than 300m above the previous nights and a rest day should be taken every 2-3 days of climbing.
In addition, prophylactic Acetazolamide can be taken. Acetazolamide is a carbonic anhydrase inhibitor which acts to promote the renal excretion of bicarbonate, thus producing a metabolic acidosis. The lowered then acts on the peripheral chemoreceptors to increase ventilation, increase PO2 and decrease PCO2. These are the changes associated with acclimatization, therefore acetazolamide can be seen to hasten the acclimatization process and minimize the occurrence of AMS. These changes are outlined in Figure 20-7.
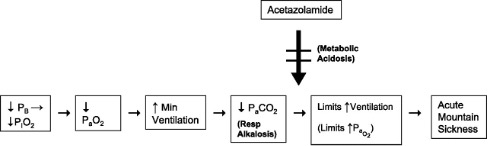
Hyperventilation causes a respiratory (Resp) alkalosis that limits the rise in ventilation and leads to symptoms of AMS. By generating metabolic acidosis, acetazolamide is able to attenuate the effects of respiratory alkalosis and improve AMS.
Because the underlying cause of AMS is the hypoxia, treatment in the most basic form is centred around improving oxygenation. Improving oxygenation can be achieved by
- not ascending to higher altitude
- if symptoms are not improving, then descending to lower altitude
- treatment in a hyperbaric Gamow bag.
Often AMS is self-limiting and improves with rest.
Acetazolamide has also been shown to be effective in the treatment (in addition to in prophylaxis) of AMS.
High Altitude Cerebral Edema
Another form of serious altitude illness, high altitude cerebral edema (HACE) normally occurs 1- 2 days after the onset of the typical AMS symptoms. The clinical features include the same symptoms of AMS; headache, nausea, and fatigue, however also include an impaired level of consciousness, hallucinations, papilloedema and if not treated- coma and death. HACE often is coexistent with HAPE as both indicate a failure of adequate adaptation to the high-altitude environment.
HACE is thought to represent an extreme form of AMS (Figure 20-6) with a similar underlying pathophysiology. It is proposed that hypoxia leads to an extracellular fluid accumulation (edema) within the cranial cavity. Because the cranial cavity is a rigid structure, an increase in extracellular fluid volume can quickly cause an increase in intracranial pressures with associated neurological disturbance (confusion, altered level of consciousness, and papilloedema). The edema appears to be related to vessel leakiness (vasogenic) rather than neuronal cell dysfunction (cytotoxic), because the degree hypoxia in HACE cases is not normally sufficient to cause failure of cerebral cellular ion pumps and subsequent cytotoxic edema.
Like AMS, some subjects are more prone to developing HACE. One hypothesis for inherent susceptibility is that some subjects have a ‘tighter fit’ of their brain within their rigid boney cavity. Therefore, for a given increase in brain ECF volume, these subjects will have a greater increase in intracranial pressure i.e. their cranial cavity is less compliant. This is known as the ‘tight fit hypothesis’ (Hackett, 1999).
The treatment of HACE is similar to that of AMS in that the most important treatment involves optimizing oxygenation. Options again include descent to lower altitude, hyperbaric treatment in a Gamow bag, and oxygen administration. Strategies to decrease intracranial pressures involve dexamethasone treatment.
Research Box: High Altitude Pulmonary Edema
High altitude pulmonary edema (HAPE) is a condition affecting normally healthy individuals upon rapid ascent to high altitude. initially presents with breathlessness. However, the breathlessness in HAPE continues to deteriorate and is then accompanied by productive cough. Chest pain, weakness and headache are also common symptoms. Clinical signs include central cyanosis tachypnea, tachycardia, and lung crackles on auscultation. These lung crackles indicate fluid in the alveoli – pulmonary edema. A chest x-ray (not normally performed because of low availability in mountainous regions) demonstrates bilateral patchy opacities with a normal cardiac silhouette (Milledge, 2006).
Pathophysiology
A Non-Cardiogenic Pulmonary Edema:
The first reports of HAPE again can be traced back to TH Ravenhill at the beginning of the 20th century, when he described the various forms of mountain sickness in the highlands of South America. He divided mountain sickness into 2 forms: Soroche (meaning cerebral) and Puna (meaning cardiac). Despite this initial description, it was not until about 50 years later that investigations into the pathophysiology of HAPE were performed.
The most common reason for fluid in the lungs is left-sided heart failure, leading to elevated pulmonary capillary pressures and fluid shifts into the alveoli. Therefore, early investigation focused on the heart. Patient’s ECG’s showed a right axis deviation, potentially indicating right ventricular hypertrophy. This right ventricular hypertrophy could have been caused by either left-sided heart failure, or primary elevated pulmonary pressures. Research has revealed that pulmonary artery pressures were markedly raised and importantly, left sided heart pressures were not elevated (Penaloza and Sime, 1969). This lay to rest ideas that HAPE was caused by heart failure and indicated that pulmonary arterial hypertension may be an important factor. In the latter half of the 20th century, focus turned to describing the nature of the fluid with the hope of gaining further insight into the pathophysiology of HAPE.
WHAT’S IN THE FLUID? Edema in any tissue can be caused by an increased hydrostatic pressure, decreased plasma oncotic pressure, damage to the vascular membrane, or impaired lymphatic and vascular reuptake of the fluid. Bold studies performed in the late 1980’s helped clarify the pathophysiology of HAPE by analyzing the cytological, biochemical, and immunologic make-up of the pulmonary edema fluid. Schoene and his co-workers in 1986 performed bronchoalveolar lavage (an invasive medical technique for obtaining alveolar fluid samples) on 3 mountaineers on Mt Denali with established HAPE and compared this with healthy controls on the same mountain (Schoene and Hackett et al., 1986). The bronchoalveolar lavage fluid showed increased levels of high molecular weight proteins, red blood cells, macrophages, and inflammatory markers indicating that the alveolar edema involved an increased permeability of pulmonary capillaries and that inflammation may contribute to this.
Subsequent studies in the Italian alps showed that in the early stages of HAPE, the alveolar fluid was rich in high molecular weight proteins but contained no evidence of inflammation (Swenson and Maggiorini et al., 2002). This demonstrated that the inflammatory response, although potentially important in the maintenance of HAPE, is not responsible for the initiation of HAPE.
High Altitude Pulmonary Edema Susceptible Mountaineers:
In the late 20th century, it became apparent that there were groups of climbers who were especially prone to developing HAPE, whereas other climbers were relatively resistant. This fact spawned a series of studies comparing HAPE susceptible and non-HAPE susceptible after rapid ascent to altitude. These daring studies, mostly performed in the Capanna Margherita laboratory in the Italian Alps, have yielded significant insight into the pathophysiology of HAPE.
In one such study, Duplain and colleagues took a group of susceptible and non-HAPE susceptible mountaineers rapidly up to 4600 m and ‘successfully’ induced HAPE (Duplain and Sartori et al., 2000). The pulmonary artery pressures and exhaled nitric oxide were measured in these subjects and it was found that those who developed HAPE had significantly higher pulmonary pressures and significantly lower exhaled nitric oxide. Inhalation of nitric oxide in these subjects has also been shown to be an effective treatment for HAPE (Scherrer and Vollenweider et al., 1996). These studies have led to the hypothesis that a genetic propensity to decreased pulmonary production is an important factor in the of HAPE. In accordance with this, there have been further studies finding a defect in the endothelial nitric oxide synthase gene in those susceptible to HAPE (Droma and Hanaoka et al., 2002).
Other factors that have been shown to predispose to the of HAPE include a blunted hypoxic ventilatory response, an exaggerated pulmonary vascular response to exercise and hypoxia, increased sympathetic tone, and small lung volumes (Figure 20-8).
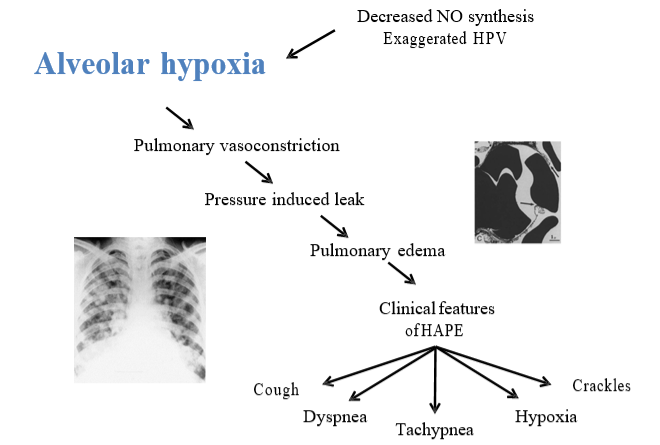
A STRESS-INDUCED LEAK: The increased pulmonary pressures cause an increased pulmonary capillary hydrostatic pressure, so much so that the capillary endothelium begins to strain and even ruptures; leading to the extravasation of red blood cells, large protein, and macrophages into the alveolar space. This alveolar edema leads to ventilation perfusion mismatch and impaired pulmonary gas exchange. This gives rise to breathlessness, cough, cyanosis, tachycardia, and the lowered SpO2.
TREATMENT: Treatment of HAPE involves reducing the stimulus for the vasoconstriction; alveolar hypoxia, and secondly by directly dilating the pulmonary arteries, thereby reducing the hydrostatic pressure and fluid movement to the alveolar space.
Methods of reducing the alveolar hypoxia include: descent to lower altitudes, hyperbaric treatment in a Gamow bag if descent is impossible, and oxygen administration by facemask or nasal cannula. Methods to directly dilate pulmonary vessels and decrease pulmonary pressures include pharmacological treatment with the calcium blocker Nifedipine, the phosphodiesterase inhibitor Sildenafil, or the glucocorticoid Dexamethasone.
Sleep at High Altitude
Decreased quality of sleep is an almost universal subjective complaint amongst visitors to high altitude and this is supported by objective evidence of an increased frequency of arousals, decreased time spent in ‘deep’ sleep (stage 3 and 4 slow wave sleep), a decreased time spent in REM sleep, and the of periodic breathing. The reason for these changes in sleep is, like the rest of the illnesses we have discussed, the underlying hypoxia; however, in contrast to acute mountain sickness, periodic breathing at high altitude gets worse and not better during acclimatization. This implies that the etiology of periodic breathing at altitude is distinct from that of AMS.
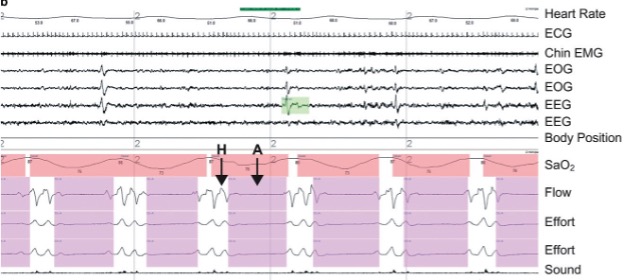
The mechanism of periodic breathing at high altitude is thought to involve an increase in sensitivity of the peripheral and central chemoreceptors such that any disturbance in breathing (i.e., a sigh or a breath hold) will trigger overcompensation in ventilation, resulting in alternating periods of apnea and hyperventilation. For example, if during sleep at sea level, someone has a transient breath hold (a decrease in ventilation), the PCO2 at the central chemoreceptors will increase. This will result in an increase in ventilation to bring the PCO2 back to baseline and stabilize the breathing pattern. At high altitude, the increase in ventilation for a given increase in PaCO2, is increased (central chemo sensitivity is increased). Therefore, after a breath hold, the ventilation will increase to a level greater than is required and PaCO2 is decreased below baseline and below the threshold to breathe – resulting in an apnea. An unstable system is created where the breathing pattern oscillates between hyperventilation and apnea. A ventilation trace of periodic breathing is shown in Figure 20-9. Acetazolamide can also be used to help reduce the degree of periodic breathing during sleep and improve sleep quality; this is another pathway in which Acetazolamide can improve symptoms of AMS.
Blood Response
Haemoglobin
One of the most well-known physiological responses to high altitude is the increase in haemoglobin concentration. This increase in haemoglobin concentration is useful because it results in an increase in oxygen carrying capacity of the blood and therefore increases the body’s ability to supply oxygen to the tissues. Interestingly, there is no apparent correlation between haemoglobin concentration at high altitude and exercise performance. This physiological response has however been exploited in the sporting world with blood doping and EPO injections.
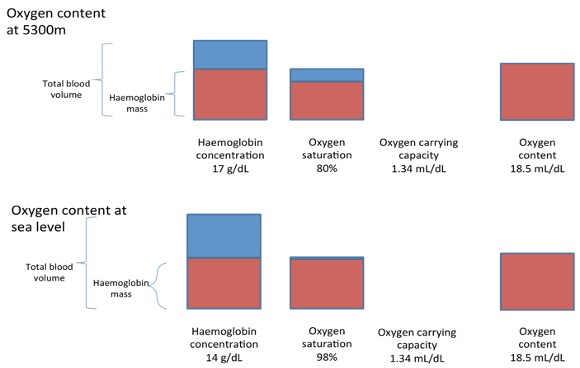
Oxygen Transport
To understand how an increased haemoglobin concentration helps us at high altitude we need to review how oxygen is transported in the blood. The total amount of oxygen carried in the blood is the amount of oxygen carried by haemoglobin, and the amount of oxygen dissolved in the blood. Of these two, oxygen carried by haemoglobin is by far the most important. The amount of oxygen carried by haemoglobin can be calculated as the product of the total haemoglobin concentration in g∙dL-1, the amount of oxygen each gram of haemoglobin can carry (ml∙g-1), and the percentage of this total haemoglobin that is saturated with oxygen. This is summarized in the formula below.
Oxygen content = [Hb]∙oxygen saturation∙oxygen carrying capacity of haemoglobin + oxygen dissolved in the blood Equation 20-8
Because oxygen is poorly soluble in blood, this contribution towards total oxygen content is extremely small (0.003∙PaO2). If we again take the case of Rachel at 5000m, her oxygen saturation was ~80%, PaO2= 50, haemoglobin concentration 17.0 g∙dL-1, and oxygen carrying capacity (1.34 ml∙g-1).
This results in:
Oxygen content = 17.0∙0.80∙1.34 + 50∙0.003
Oxygen content = 18.34 mL∙dL-1
Interestingly, if we look at the situation of sea level, Rachel’s haemoglobin concentration is likely to have been ~14 g∙dL-1, her oxygen saturation 98% and her oxygen carrying capacity unchanged at 1.34 ml∙g-1 and her PaO2 of 100 mm Hg. This gives a sea level total oxygen content of:
Oxygen content = 14.0∙0.98∙1.34 +100∙0.003
Oxygen content = 18.68 mL∙dL-1, a value very similar to that at 5000m altitude.
If there was no increase in Hb concentration with altitude, the total oxygen content would be about 20% lower than at sea level:
Oxygen content = 14.0∙0.80∙1.34+50∙0.003
Oxygen content = 15.16 mL∙dL-1
Why does Haemoglobin Concentration Increase at High Altitude?
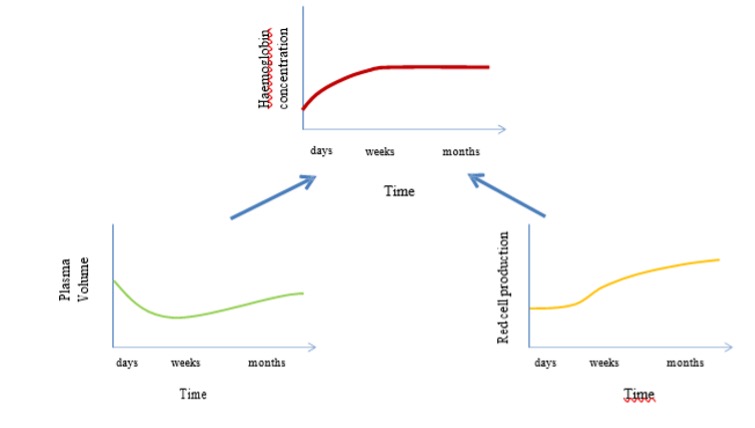
The increase in haemoglobin concentration at high altitude is caused initially by a decrease in plasma volume and then later by an increase in red blood cell production (fig 20-11). The initial plasma volume contraction is caused by hypoxia mediated diuresis, and the increase in red blood cell production (erythropoiesis) is caused by a hypoxia mediated increase in erythropoietin secretion.
The link between hypoxia and erythropoietin secretion involves hypoxia inducible factor 1 alpha (HIF 1 alpha). HIF 1alpha is a protein that is rapidly degraded by normoxia but accumulates during hypoxia. It has many different effects, but importantly, it binds to the promoter region of the erythropoetin gene and upregulates transcription.
Acute exposure to hypoxia results in a rise in blood erythropoietin concentration that is detectable within hours. The erythropoetin concentration reaches a maximum after ~ 48 hours (Milledge and Cotes 1985), and then declines to reach sea level values after about 3 weeks. If we plot the changes in EPO concentration, and packed cell volume (an index of erythropoeisis and Hb concentration), against the time spent at altitude, we can see that packed cell volume is very slow to increase (over a period of 3 weeks) whilst the EPO peaks early with altitude exposure and then declines to reach sea level values after ~ 3 weeks.
However this increase in haemoglobin concentration is not without its disadvantages. The price paid for the increase in oxygen carrying capacity of the blood is an increase in blood viscosity with an associated increase in vascular resistance. This disadvantageous response is most apparent in chronic mountain sickness patients, where haemoglobin concentration can reach levels of above 22 g∙dL-1 with attendant symptoms and signs of headache, malaise, pulmonary hypertension, and cyanosis. This condition is best treated with descent to a lower altitude or the removal of blood from the body.
Acid-Base Balance
With ascent to high altitude, changes in respiratory and renal function lead to changes in CO2 and HCO3- in the blood. These changes can have a marked effect on and protein function. How these changes in respiratory and renal function affect pH is considered below.
When CO2 is dissolved in blood it reacts with water to form carbonic acid (H2CO3) at a one-to-one ratio. This carbonic acid then dissociates into H+ and bicarbonate at concentrations determined by the dissociation constant for carbonic acid (KA).
CO2 + H3O H3CO3 HCO3– + H+ Equation 20-9
KA = [HCO3-][H+]∙[H2CO3]-1 Equation 20-10a
And because H2CO3 is produced at a 1 to 1 ratio from CO2 then CO2 can replace H2CO3.
Therefore, taking logs:
log KA = log [H+] + log [HCO3-]∙[CO2] -1 Equation 20-10b
-log [H+] = -log KA + log HCO3-]∙[CO2] -1 Equation 20-10c
If we let ‘–log = p,’ then we have:
pH = pKA + log [HCO3–]∙[CO2] -1 Equation 20-10d
where pKA is 6.1.
This is known as the Henderson-Hasselbalch equation.
How does this mathematics relate to physiology at high altitude? Because of the hypoxic induced hyperventilation described above, the arterial PCO2 levels are decreased at high altitude. This decrease in PaCO2, causes an increase in according to the Henderson-Hasselbalch equation:
pH = 6.1 + log ( [HCO3-]∙[CO2]-1)
at sea level:
pH = 6.1 + log (24/40∙0.03)
where 0.03 is the conversion factor (Henry’s constant) from mM to partial pressure in mm Hg according to Henrys law (see chapter 7)
pH = 7.4
At high altitude, the hyperventilation associated hypocapnia, causes a decrease in bicarbonate and therefore an increase in . For example at an altitude of 5000m arterial PCO2 typically decreases to 25 mm Hg and HCO3- is typically ~20 mmol∙L-1 and therefore:
pH = 6.1 + log (20/0.03∙25) pH= 6.1 + log 26.7
pH = 6.1 + 1.43
pH = 7.53
This respiratory alkalosis typically causes a metabolic compensation, involving bicarbonate excretion through the kidneys. This decrease in bicarbonate reduces the base to acid ratio and hence brings the back down towards neutral (7.4).
Acid Base Balance and the Oxygen Dissociation Curve
Changes in of the body can have far reaching effects, mainly due to alteration in protein function. In the case of high altitude, the change in pH has marked effects on the oxygen dissociation curve.
As reviewed in chapter 7, many factors can affect the position of the oxygen dissociation curve: an increase in temperature, CO2, H+, and 2,3 bisphosphoglycerate (2,3 BPG) shift the curve to the right, whilst a decrease in temperature, CO2, H+, and 2,3 BPG all cause a leftward shift in the curve.
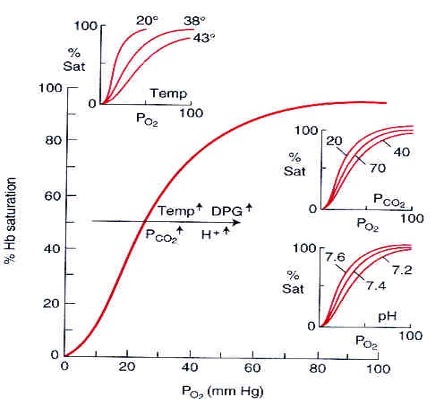
This leftward shift can be considered beneficial at extreme altitudes as it optimizes in the pulmonary capillaries; for a given PO2 in the pulmonary blood, oxygen saturation will be increased. Normalization with metabolic compensation and in increase in 2,3 BPG tends to shift the curve back towards its resting position at after time at altitude.
Acid Base Research at Extreme High Altitude
In 2008, a group of scientists from the UK set off to Mt Everest with the goal to obtain arterial blood gas samples at the summit of Mt Everest (Grocott and Martin et al. 2009). Until then arterial samples had been taken in 2 hypobaric chamber studies in which barometric pressure was gradually decreased to that of the summit of Mt Everest. Blood gas samples were taken in four subjects just below the summit at a height of 8400m. These represent the highest blood gas samples to be obtained to date and yield significant insight not only into high altitude physiology, and as the authors point out, but also into the physiology of critically ill patients in the intensive care unit.
At 8400m the average blood gas parameters for the four subjects were as follows: 7.53, PO2 24.6 mm Hg, PCO2 24.6 mm Hg, base excess -6.9, lactate of 2.2 mol∙L-1, haemoglobin of 19.3 g∙dl-1, oxygen saturation of 54% and an average alveolar to arterial gradient of 5.4 mm Hg (Grocott and Martin et al. 2009). These values represent the highest altitude that such recordings have ever been recorded and also possibly the lowest arterial oxygen pressures and saturations ever recorded in healthy humans.
Throughout the ascent of Everest, calculated oxygen content remained stable despite the reduced SaO2 (owing to the increase in haemoglobin concentration) until approximately 7100m. This remarkable maintenance of oxygen content indicates that a decreased oxygen content is not responsible for the marked decrease in exercise performance at these altitudes.
Brain Response
The brain is the arguably the most sensitive organ in the body. It perhaps is not surprising that brain blood flow is usually well maintained at high altitude (Severinghaus and Bainton et al., 1966; Ainslie and Ogoh, 2010). Indeed, in order to compensate for marked reductions in the CaO2 during the initial arrival to high altitude, brain blood flow may increase by 20-30% in order to maintain effective cerebral oxygen delivery. Even at extremes of altitudes (>8000m) it has been reported that cerebral vasodilation occurs, again compensating for reductions in CaO2 (Wilson and Edsell et al., 2011). Despite this maintenance of cerebral oxygen delivery, ascent to altitude results in a subtle decline in some of our more sophisticated cognitive skills. The mountain environment is potentially dangerous and the complex decisions needed for safe travel require a normal functioning brain. Some of the tragedies that have occurred at high altitude, such as the events on high on Everest in 1996, may have resulted from a critical loss of judgment (Krakauer, 1997). The mortality on descent from the summit of Everest is three times greater for those climbers not using oxygen than in those who did (Huey and Eguskitza, 2000). More recently a study into all the deaths on Mount Everest between 1921–2006 found that of the 212 deaths, 94 occurred above 8000 m (Firth and Zheng et al. 2008). Most of these deaths occurred on descent. Cognitive impairment, ataxia, profound fatigue, late summit times, and the tendency to fall behind companions were all features seen in non-survivors. Respiratory distress, nausea, vomiting, and headache, common indicators of altitude illness at 2500-5000m, were rarely noted in the non-survivors above 8000m.
Acclimatization to High Altitude: Truths and Misconceptions
The biggest misconception about acclimatization is that it returns the body to the sea level condition and the effects of high altitude are nullified by acclimatization. An example – at 4200m: Alveolar PO2 following acute exposure is about 45 mmHg. Alveolar PO2 following full acclimatization is about 54 mmHg! Patients with COPD with an arterial PO2 less than 55 mmHg are normally placed on a form of continuous oxygen therapy. Thus, the most important feature of acclimatization is hyperventilation. Polycythemia and the associated increased haemoglobin concentration is slow to develop and of minor value. Other features include increases in cellular oxidative enzymes and the concentration of capillaries in some tissues. Hypoxic pulmonary vasoconstriction is not beneficial as discussed.
Exercise at Altitude
When we exercise at altitude, there are two different and independent stressors to which the body must respond and adapt to: hypoxia and exercise. The simultaneous presence of both stressors has an additive effect that will influence maximal exercise capacity, endurance time until and overall exercise performance. When considering the physiological responses to exercise at altitude, we need to consider a number of factors:
- the degree of hypoxia incurred;
- the intensity (absolute vs relative workload) and duration of exposure to hypoxic conditions
- the inter-individual variability in adapting to hypoxic environments (responders vs non- responders)
These factors are outlined briefly below, followed by consideration of how exercise at altitude impacts each step of the oxygen cascade (Figure 20-13).
- The degree or extent of hypoxia incurred
- As mentioned, at low altitude, resting SaO2 is well maintained and thus only results in marginal disruption to homeostasis; however as we ascend to more moderate altitude (>3000m) a slight decrease in resting SaO2 (e.g., 98 to 92%) is observed as the ambient PIO2 can decreases to 110 mm Hg compared with 159 at sea level. At high altitude (approx. 5000m), ambient PO2 will decrease to around 85 mm Hg with resting SaO2 approaching 80% and lower. These decreases in PIO2 and SaO2 present a significant disruption to our resting haemostasis.
- The intensity and duration of exposure to hypoxic conditions
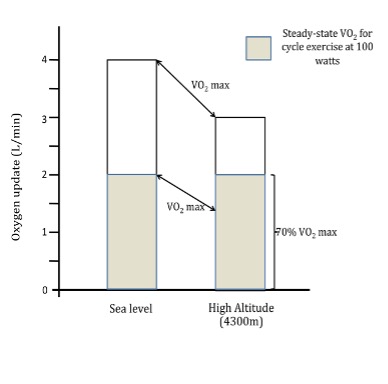
- As observed at sea level, the relative stress/intensity of exercise out plays a major role in the subsequent physiological and metabolic adjustments (e.g., cardiovascular, respiratory, hormonal). Furthermore, it should be noted that when performing the same absolute workload at altitude as at sea level, a greater relative exercise intensity is elicited that results in a greater physiological challenge and disruption to homeostasis. The main reason for this is that although the V̇O2 for a given output at high altitude is similar at sea level and altitude, the relative exercise intensity is greater as a result of the decline in V̇O2max (i.e. a constant power output represents a higher percentage of V̇O2max at high altitude). For example, cycling at a power output of 100W at sea level may elicit a V̇O2 of 1.5 L∙min-1, a value around 50% of sea level V̇O2max (Figure 20-15). When cycling at an identical workload of 100W at 4300m, a V̇O2 of 1.5 L∙min-1 may also be found. However, due to a reduction in V̇O2max at this altitude (approximately 25%), this represents a significantly greater relative exercise intensity of 65% of V̇O2max. As a result of this higher relative intensity, more dramatic physiological and metabolic adjustments are required to maintain homeostasis for a given absolute workload when performed at altitude compared to sea level.
- Inter-individual variability in adapting to hypoxic environments (responders vs non- responders)
- A final factor determining the physiological response to altitude is whether the individual is acclimatized to altitude. Thus, a sea level resident who is exposed, acutely, to a high-altitude environment will respond differently when compared to an individual who has been acclimatization to high altitude.
Exercise and the Oxygen Cascade
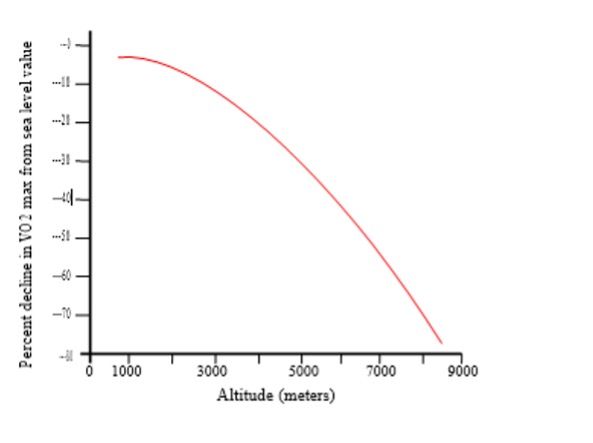
For reasons discussed, there are a number of physiological and metabolic adjustments made both at rest and during exercise at high altitude when compared with sea level. A primary goal of our body, regardless of the barometric pressure, is to ensure that an adequate amount of oxygen is delivered to the exercising muscles. We accomplish this through adaptations in the various links that make up the “oxygen cascade” (Figure 20-13). One well-reported observation as that maximal oxygen consumption is progressively reduced upon ascent to high altitude (Fig 20-15). Factors that influence this reduction in exercise capacity are outlined below.
Step 1- the Lungs
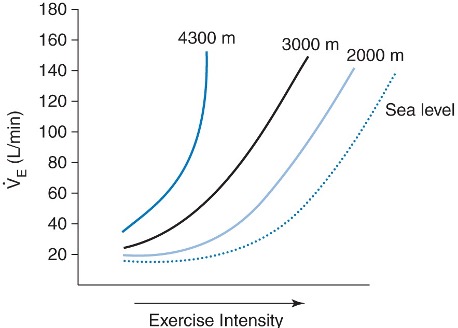
Total and ventilation, like at rest, are greater during submaximal exercise at high altitude when compared to at sea level (see Figure 20-16). Elevations in submaximal ventilation are a beneficial response as it helps to preserve alveolar and arterial oxygen pressures and thus maximize oxygen content. The mechanism underling this greater increase in submaximal ventilation is likely due to the greater reductions in PaO2 and thus more marked peripheral chemoreflex activation. Although maximal ventilation during exercise is unaltered when compared to sea level, heavy exercise stresses lung capacity to the limit. For example, unlike at sea level, PaO2 decreases during exercise at high altitude. This decrease in PaO2 is caused mainly by an incomplete diffusion but also by ventilation perfusion mismatch and shunting.
Diffusion limitation at altitude during exercise: Diffusion (i.e. movement of O2 from the alveoli to the pulmonary capillaries) across the pulmonary and tissue capillaries can become limiting at altitude, especially during exercise. As discussed in Chapter 7, the partial pressure of oxygen determines the driving force from one place to another. This diffusion driving force is equal to the alveolar to venous PO2 difference. Although the transit time remains at 0.25 sec, the driving force for diffusion is much less than at sea level. For example, the diffusion driving force is approx. 60 mmHg at sea level (calculated from subtracting PAO2 [e.g., 100mmHg] from PvO2 [40 mmHg]). In contrast, at 5000m, this diffusion driving force is approx. 20 mmHg (PAO2 [e.g., 50mmHg] from PvO2 [25 mmHg]). These changes results in marked reductions in SaO2 and related arterial hypoxemia during exercise that contributes to the decline in maximal oxygen consumption.
Step 2 – Haemoglobin
As reviewed in the section on blood response, upon exposure to altitude >2500m, significant increases in haemoglobin concentrations occur. Although an increased production of red blood cells is often viewed as the best-known feature of adaption to high altitude, this response has little role in acclimatization to high altitude that occurs over 2-3 days. Plasma volume contraction, and later, polycythaemia underlie this increase in haemoglobin concentration. The somewhat controversial topic of exposure to high altitude to improve sea level performance is highlighted in the research box below.
Step3 to 5 – Cardiac Output and Oxygen Extraction:
The next critical step in the oxygen cascade is oxygen transport via cardiac output. Consideration of the importance of Q̇ and the influence of hypoxia on oxygen delivery and utilization during exercise can be appreciated with the Fick equation:
The components of the Fick equation provide an accurate assessment of how critical elements associated with oxygen delivery and utilization are affected by both short- and long-term exposure to high altitude. These are discussed below:
Cardiac output: Cardiac output (Q̇) is a function of HR and SV. Upon initial exposure to altitude, HR and thus Q̇ increase in an attempt to compensate for the reduction oxygen content of the blood. This response helps ensure that adequate amounts of oxygen are transported to tissues, including during exercise. During submaximal workloads, the alterations in Q̇ and local muscle blood flow allow for sufficient oxygen delivery to working muscles. Consequently, for a given submaximal workload, V̇O2 remains unchanged from sea level vales. Thus, a higher Q̇ at altitude compared with sea level maintains a similar level of oxygen being transported to and utilized by working muscles. Because of reductions in maximal heart rate and SV (due to declines in plasma volume and increased hematocrit), with prolonged exposure (>1-2 weeks) to high altitude, maximal exercise cardiac output is reduced by 20-30%. Below 6000m, oxygen consumption at a particular output stays the same because of greater tissue extraction (i.e., increased a-v̅ O2 oxygen differences).
Heart rate: The initial increase in Q̇ is achieved by an increase in HR, Stimulation of the beta – receptors by cardiac sympathetic nerves and circulating epinephrine, are major contributors to the increase in HR at rest and during submaximal exercise. The alpha-adrenergic arm of the SNA may also regulate HR during acclimatization to altitude (Calbet et al., 2003). There is overwhelming evidence that the sympathetic nervous activity is increased during both short and longer-term exposure to high altitude (e.g., arterial noradrenaline and adrenaline levels, MSNA, noradrenaline spillover) (Mazzeo and Bender et al., 1991; Wolfel and Groves et al., 1991) (Hopkins and Bogaard et al., 2003) (Hansen and Sander, 2003) (Mazzeo and Child et al., 2000). It is also possible that partial parasympathetic withdrawal may mediate elevations in resting and exercising heart rates (Hopkins and Bogaard et al., 2003). In contrast, maximal HR during exercise is reduced with increasing severity of hypoxia. Estimates reveal an approximately 1 bmin-1 reduction in peak HR for every 7-mmHg decrease in barometric pressure below 530 mmHg (approximately 130 m of altitude gained above 3100 m).
Stroke volume: Upon initial exposure to altitude, SV appears to be only marginally affected during submaximal exercise. However, with a prolonged exposure to altitude, SV clearly declines over time, stabilizing after 1-2 weeks. Loss of plasma volume is likely to be an important mechanism explaining this reduction in SV. Reductions in plasma volume will lead to reductions in LV filling thereby yielding a lower stroke volume (via the Frank-Starling effect). It is also possible that the increase in the after-load placed upon the heart can contribute to the reduction in SV over time at altitude. Elevations in SNA at altitude results in a progressive increase in systemic vascular resistance and thus MAP. At higher exercise intensities, O2 delivery cannot keep up with muscle demand. This limitation is reflected by the well-known progressive decline in V̇O2max with increasing altitude (Figure 20-16) (Calbet and Boushel et al., 2003). This reduction during initial exposure is directly associated to the decline in the exercising CaO2 as maximal Q̇ is unaltered in the short-term. With partial acclimatization (1-3 weeks), for a given output, Q̇ is reduced from initial exposure due to:
- a decrease in SV due to a reduced venous filling
- a decrease in maximal HR due to a reduction in cardiac responsiveness to -adrenergic stimulation (Wagner, 2000) and/or an increase in vagal tone (Hopkins and Bogaard et al., 2003)
As a result of these declines in Q̇and muscle blood flow with acclimatization, V̇O2max is still reduced despite significant increases in CaO2 coupled with enhanced O2 extraction by the muscle. The reduction in V̇O2max is predominantly explained by the reduction in Q̇max as well as re-distribution of blood flow to non-exercising tissues (Calbet and Boushel et al., 2003). At higher altitudes, a fall in maximal HR can also contribute to the decline in Q̇max.
(a-v̅)O2 DIFFERENCE
Muscle blood flow: Studies at 4300 m and 5260 m have revealed that while SaO2 and red blood cell numbers increase with acclimatization, net oxygen delivery to exercising muscles did not increase accordingly (reviewed in: (Mazzeo, 2008). This reduction was the result of a decrease (20-30%) in muscle blood flow during exercise, thereby offsetting the improvements in O2 content. Thus, O2 delivery to the muscle remains unchanged after acclimatization when compared with short-term altitude exposure. Thus, it seems that O2 delivery to exercising muscle during submaximal exercise is tightly regulated so that delivery = demand. The mechanisms underpinning these reductions in muscle blood flow are likely caused by:
- increases in nor-adrenaline concentrations
- reductions in Q̇
Oxygen extraction: A number of studies have reported that oxygen diffusing capacity is not a limiting factor during exercise at high altitude (reviewed in: (Mazzeo 2008)). Additionally, fractional extraction by exercising muscle appears to be the same before and after acclimatization, suggesting that diffusion and utilization by is not compromised. Studies collectively show that – as with sea-level exercise – as V̇O2 increases, working muscles are capable of extracting oxygen as needed under hypoxic conditions during submaximal exercise. Thus, working muscle can match delivery and extraction to match metabolic demand during submaximal exercise at altitude. At these intensities, reductions in Q̇ and O2 delivery are compensated for by increased O2 extraction (as indicated by an increase in the (a-v̅)O2 differences compared with short-term altitude exposure yielding values similar to that found during absolute workload at sea level.
Step 6: Cellular metabolism:
The final step in the oxygen cascade is cellular metabolism. To date, assuming adequate energy intake, there are few significant measurable changes in muscle or cellular metabolism at high altitude or with acclimatization. Levels of adenosine triphosphate, creatine phosphate, muscle and heart glycogen, oxidative and glycolytic enzymes remain unchanged with acclimatization. Recent research using sophisticated measurement techniques have also revealed that 9-11 days of exposure to high altitude (4560m) does not markedly modify integrated measures of mitochondrial functional capacity in skeletal muscle despite significant decrements to enzyme concentrations involved in the tricarboxylic acid cycle and phosphorylation (Jacobs and Boushel et al. 2012). Thus, the mechanisms behind improved exercise capacity at high altitude following partial acclimatization are likely independent of changes in cellular metabolism.
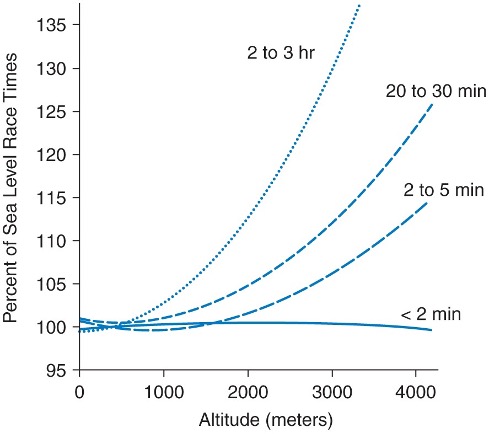
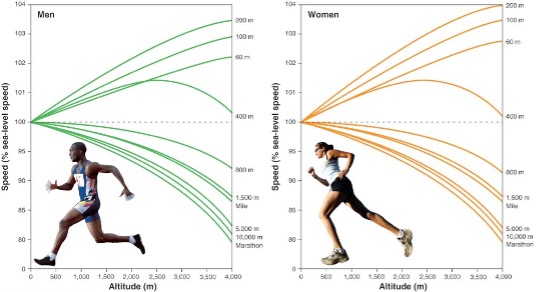
EXERCISE CAPACITY: Altitude per se causes marked improvements in events of short duration and high intensity exercise (e.g., sprints and throwing events) and marked impairments in events of long duration and lower intensity (e.g. endurance sports). Gravity decreases by 0.3 cm∙sec-2 for every 1000m of altitude, and wind resistance decreases with decreased air density. Both of these factors are beneficial at altitude for athletes involved in short-term maximal events. At altitude, there is a decline in running events greater than 800 m (or over >2 min). In the Mexico City Olympic in 1968, many athletes who had world-class times at sea level were defeated by high altitude natives (eg, Kenyans and Ethiopian runners). Figures 20-17 and 20-19 show the typical physical performance decrements as a function of exercise duration and elevation.
EXERCISE PERFORMANCE: High altitude training has become a mainstay in endurance sports, with live high-train low being the current protocol of choice. Athletes either live or sleep in artificial or natural hypoxic conditions with the aim to increase serum erythropoietin concentrations, which are thought to improve maximum and thus exercise performance. Changes, however, are not very striking and only apparent in so-called responders, who are not a well-defined group and may be as little as 50% of the trained study population. Whereas some studies show minor improvement (Stray-Gundersen and Levine 2008), others report no change (Lundby and Millet et al., 2012; Robach and Lundby, 2012) or even worsening. Furthermore, the mechanisms behind the proposed beneficial changes remain obscure and are far from being proven.
There is an evident lack of sufficiently powered randomized, double-blinded studies, with training protocols that are identical and comparable for all groups. Several studies discriminate between responders and non-responders, without clearly assessing the characteristics of the so- called responders. Until this has been done, it remains unclear if such a group really exists and how these subjects are characterized. This, however, would be of immense value, so protocols could be tailored to athletes’ needs. Taken together, the current literature on natural or artificial hypoxia somewhat documents improved performance at high but not low altitude. Nevertheless, many elite athletes and their coaches strongly believe in altitude training for competition at sea level. In addition, athletes from Kenya (located at 2000-3000m ASL) are well known for their superior endurance performance at sea level. Thus, some benefits of high-altitude training cannot be excluded.
ALTITUDE EXPOSURE TRAINING TECHNIQUES:
Taking some of the information about altitude training into consideration, various techniques have been devised in order to expose the athlete to the beneficial effects of high altitude whilst not reducing their ability to train effectively. These have been labelled ‘Live High – Train High, ‘Live Low – Train High’ and ‘Live High – Train Low’. The typical altitudes used are around 2000-2500m, which, in itself, reduces the risk of some of the unhelpful effects of altitude exposure. The ‘low’ altitudes may not actually be at sea level, but could be 1250m, for example. However, the difference between the two altitudes is significant enough to have an effect on training.
Live High – Train High: Maximum exposure to altitude. Evidence of a positive effect at sea level is controversial, and there is less support for this method amongst experts.
Live Low – Train High: The idea behind this regime is that the athlete is exercising in a low oxygen environment, whilst resting in a normal oxygen environment. There have been some interesting findings suggesting that this technique might work, but there are no good studies showing that the technique makes any difference to the ultimate competitive performance of the athlete at sea-level. Additionally, training intensity is reduced so some athletes may find that they actually lose fitness using this regime.
Live High – Train Low (LHTL): The theory behind this regime is that the body will acclimatize to altitude by living there, whilst training intensity can be maintained by training at (or near) sea level. Hence, the beneficial effects of altitude exposure are harnessed whilst some of the negative ones are avoided. However, residence at altitude must be for more than 12 hours per day and for at least 3 weeks. With this technique, some improvements in sea-level performance have been shown in events lasting between 8 and 20 minutes (Bailey and Davies, 1997; Bailey and Davies et al., 1998). However, as mentioned there are a lack of sufficiently powered randomized, double-blinded studies, with training protocols that are identical for all groups. Support for the lack of ‘true’ influence of LHTL comes from the first placebo-controlled and double-blinded design (Nordsborg and Siebenmann et al., 2012). In this study, 16 endurance cyclists trained for 8 wk at low altitude (<1,200 m). After a 2-wk lead-in period, athletes spent 16 hday-1 for the following 4 wk in rooms flushed with either normal air (placebo group, n = 6) or normobaric hypoxia, corresponding to an altitude of 3,000 m (LHTL group, n = 10). Physiological investigations were performed twice during the lead-in period, after 3 and 4 wk during the LHTL intervention, and again, 1 and 2 wk after the LHTL intervention. Weekly training effort was similar between groups. Hb mass, in normoxia, and at a simulated altitude of 2,500 m and mean output in a simulated, 26-km time trial remained unchanged in both groups throughout the study. Exercise oxygen cost (i.e.,V̇O2 measured at 200 W) did not change during the LHTL intervention and was never significantly different between groups. The authors concluded that, 4 weeks of LHTL, using 16 h∙day-1 of normobaric hypoxia, did not improve endurance performance or any of the measured, associated physiological variables.
Body Composition and Nutrition
Weight loss and muscle atrophy are common at altitude. Studies have reported weight losses of 100-200g∙day-1. The weight loss is due to a combination of factors including: dehydration (via hyperventilation induced respiratory fluid loss and reductions of fluid intake), energy imbalance, increased activity levels and elevations in basal metabolic rate. Although in the past, lack of available food would likely have played an important role in the of a negative energy balance, it is not the case today due to better energy dense food and availability even at extreme altitudes. In addition, although the sensation of exertion during climbing at high altitude is high, the actual energy expenditure is not high (Westerterp and Kayser et al., 1992). Thus, it is energy intake that is reduced at altitude and it is this that induces an energy deficit resulting in the loss of body mass. The mechanisms responsible for the reduction in energy intake are unclear but may involve the influence of hypoxia on the central pathways of appetite control (Bailey and Ainslie et al., 2004).
Summary
Ascent to – and exercise at – altitude has an impact on each step of the oxygen cascade. The most beneficial response to the initial exposure to high altitude is the increase in ventilation which helps offset the reductions in arterial P02 and hence blood oxygen content. Thereafter, increases in hemoglobin concentration further facilitate elevations in oxygen content. There is a well-established decline in V̇O2max with increasing altitude (Figure 20-15). This reduction during initial exposure is directly associated with the decline in the exercising CaO2 as maximal Q̇ is unaltered in the short-term. With acclimatization, there are declines in Q̇ and muscle blood flow and hence V̇O2max is still reduced despite significant increases in CaO2 coupled with enhanced O2 extraction by the muscles. The reduction in V̇O2max is predominantly explained by the reduction in Q̇max as well as re-distribution of blood flow to non-exercising tissues. At higher altitudes, a fall in maximal HR can also contribute to the decline in Q̇max.
There are many pathophysiological effects of the high-altitude environment. The most common is AMS – a self-limiting condition affecting a >50% of those who ascend >3500m. The incidence depends upon both the absolute altitude and the rate of ascent such that at below an altitude of 2000m, AMS is rare, and above 5000m it is almost universal. More serious forms of altitude illness include pulmonary and cerebral edema. Although medications for the treatment of altitude illness are available, descent still remains the most effective approach (if possible).
High altitude training has become a mainstay in many endurance sports, with a variety of approaches to do this. Athletes either live or sleep in artificial or natural hypoxic conditions with the aim to increase serum erythropoietin concentrations, which are thought to improve maximum and thus exercise performance. Changes, however, are not very striking and only apparent in so-called responders, who are not a well-defined group and may be as little as 50% of the trained study population.
Topics for Discussion
- Describe the mechanisms that drive the two most important responses of acclimatization; hyperventilation and elevations in hemoglobin
- Provide an overview of why maximal exercise capacity is reduced at high altitude
- You have been ask to volunteer and help organize a trek to Everest basecamp. What precautions would you take during ascent and what would be the main medications that would be prudent to have for the treatment of altitude illness?
- Describe the advice and considerations you would give to an athlete at sea-level who is wanted to incorporate some form of ‘altitude’ training into their schedule.
References
Ainslie PN and Ogoh S. 2010. Regulation of cerebral blood flow in mammals during chronic hypoxia: a matter of balance. Experimental Physiology 95(2):251‐62.
Bailey DM, Ainslie PN, Jackson SK, Richardson RS, Ghatei M. 2004. Evidence against redox regulation of energy homoeostasis in humans at high altitude. Clinical Science (London) 107(6):589‐600.
Bailey DM and Davies B. 1997. Physiological implications of altitude training for endurance performance at sea level: a review. British Journal of Sports Medicine 31(3):183‐90.
Bailey DM, Davies B, Romer L, Castell L, Newsholme E, Gandy G. 1998. Implications of moderate altitude training for sea‐level endurance in elite distance runners. European Journal of Applied Physiology and Occupational Physiology 78(4):360‐8.
Barcroft J, Douglas CG, Kendal LP, Margaria R. 1931. Muscular exercise at low barometric pressures. Arch Sci Biol Napoli 16:609‐615.
Calbet JAL, Boushel R, Radegran G, Sondergaard H, Wagner PD, Saltin B. Why is Vo(2max) after altitude acclimatization still reduced despite normalization of arterial O‐2 content? American Journal of Physiology‐Regulatory Integrative and Comparative physiology 284(2):R304‐R316.
Droma Y, Hanaoka M, Ota M, Katsuyama Y, Koizumi T, Fujimoto K, Kobayashi T, Kubo K. 2002. Positive association of the endothelial nitric oxide synthase gene polymorphisms with high‐altitude pulmonary edema. Circulation 106(7):826‐30.
Duplain H, Sartori C, Lepori M, Egli M, Allemann Y, Nicod P, Scherrer U. 2000. Exhaled nitric oxide in high‐altitude pulmonary edema: role in the regulation of pulmonary vascular tone and evidence for a role against inflammation. American Journal of Respiratory and Critical Care Medicine 162(1):221‐4.
Fan JL, Burgess KR, Basnyat R, Thomas KN, Peebles KC, Lucas SJ, Lucas RA, Donnelly J, Cotter JD, Ainslie PN. 2010. Influence of high altitude on cerebrovascular and ventilatory responsiveness to CO2. The Journal of Physiology 588(Pt 3):539‐49.
Firth PG, Zheng H, Windsor JS, Sutherland AI, Imray CH, Moore GW, Semple JL, Roach RC, Salisbury RA. 2008. Mortality on Mount Everest, 1921‐2006: descriptive study. The BMJ 337:a2654.
Fulco CS, Rock PB, Cymerman A. 1998. Maximal and submaximal exercise performance at altitude. Aviation, Space, and Environmental Medicine 69(8):793‐801.
Grocott MPW, Martin DS, Levett DZ, McMorrow R, Windsor J, Montgomery HE; Caudwell Xtreme Everest Research Group. 2009. Arterial Blood Gases and Oxygen Content in Climbers on Mount Everest. New England Journal of Medicine 360(2):140‐149.
Hackett PH. 1999. The cerebral etiology of high‐altitude cerebral edema and acute mountain sickness. Wilderness & Environmental Medicine 10(2):97‐109.
Hansen J and Sander M. 2003. Sympathetic neural overactivity in healthy humans after prolonged exposure to hypobaric hypoxia. Journal of Physiology‐London 546(3):921‐929.
Hopkins SR, Bogaard HJ, Niizeki K, Yamaya Y, Ziegler MG, Wagner PD.. 2003. beta‐adrenergic or parasympathetic inhibition, heart rate and cardiac output during normoxic and acute hypoxic exercise in humans. Journal of Physiology‐London 550(2):605‐616.
Huey RB and Eguskitza X. 2000. Supplemental oxygen and mountaineer death rates on Everest and K2. The Journal of American Medical Association 284(2):181.
Jacobs RA, Boushel R, Wright-Paradis C, Calbet JA, Robach P, Gnaiger E, Lundby C. 2013. Mitochondrial function in human skeletal muscle following high altitude exposure. Experimental Physiology. 98(1): 245-55.
Krakauer, J. (1997). Into Thin Air. New York, Villard.
Lundby C, Millet GP, Calbet JA, Bärtsch P, Subudhi AW. 2012. Does ‘altitude training’ increase exercise performance in elite athletes? British Journal of Sports Medicine 46(11):792‐5.
Mazzeo RS. 2008. Physiological responses to exercise at altitude: an update. Sports Medicine 38(1):1‐8.
Mazzeo RS, Bender PR, Brooks GA, Butterfield GE, Groves BM, Sutton JR, Wolfel EE, Reeves JT.. 1991. Arterial Catecholamine Responses during Exercise with Acute and Chronic High‐Altitude Exposure. American Journal of Physiology 261(4):E419‐E424.
Mazzeo RS, Child A, Butterfield GE, Braun B, Rock PB, Wolfel EE, Zamudio S, Moore LG.. 2000. Sympathoadrenal responses to submaximal exercise in women after acclimatization to 4,300 meters. Metabolism 49(8):1036‐42.
Messner R. (1979). Everest: Expedition to the Ultimate. London, Kaye and Ward.
Milledge JS. 2006. Altitude medicine and physiology including heat and cold: a review. Travel Medicine and Infectious Disease 4(3‐4):223‐37.
Milledge JS and Cotes PM. 1985. Serum erythropoietin in humans at high altitude and its relation to plasma renin. Journal of Applied Physiology 59(2):360‐4.
Nordsborg NB, Siebenmann C, Jacobs RA, Rasmussen P, Diaz V, Robach P, Lundby C. 2012. Four weeks of normobaric “live high-‐train low” do not alter muscular or systemic capacity for maintaining pH and K(+) homeostasis during intense exercise. Journal of Applied Physiology 112(12):2027‐36.
Penaloza D and Sime F. 1969. Circulatory dynamics during high altitude pulmonary edema. American Journal of Cardiology 23(3):369‐78.
Peronnet F, Thibault G, Cousineau DL. 1991. A theoretical analysis of the effect of altitude on running performance. Journal of Applied Physiology 70(1):399‐404.
Richalet JP, Larmignat P, Poitrine E, Letournel M, Canouï-Poitrine F. 2012. Physiological risk factors for severe high‐altitude illness: a prospective cohort study. American Journal of Respiratory and Critical Care Medicine 185(2):192‐8.
Roach RC and Hackett PH. 2001. Frontiers of hypoxia research: acute mountain sickness. Journal of Experimental Biology 204(Pt 18):3161‐70.
Robach P and Lundby C. 2012. Is live high‐train low altitude training relevant for elite athletes with already high total hemoglobin mass? Scandinavian Journal of Medicine & Science in Sports 22(3):303‐5.
Scherrer U, Vollenweider L , Delabays A, Savcic M, Eichenberger U, Kleger GR, Fikrle A, Ballmer PE, Nicod P, Bärtsch P. 1996. Inhaled nitric oxide for high‐altitude pulmonary edema. The New England Journal of Medicine 334(10):624‐9.
Schoene RB, Hackett PH , Henderson WR, Sage EH, Chow M, Roach RC, Mills WJ Jr, Martin TR.. 1986. High‐altitude pulmonary edema. Characteristics of lung lavage fluid. The Journal of the American Medical Association 256(1):63‐9.
Severinghaus JW, Bainton CR, Carcelen A.. 1966. Respiratory insensitivity to hypoxia in chronically hypoxic man. Respiration Physiology 1(3):308‐34..
Stray‐Gundersen, J and Levine BD. 2008. Live high, train low at natural altitude. Scandinavian Journal of Medicine & Science in Sports 18 Suppl 1:21‐8.
Sutton JR, Reeves JT, Wagner PD, Groves BM, Cymerman A, Malconian MK, Rock PB, Young PM, Walter SD, Houston CS. . 1988. Operation Everest II: oxygen transport during exercise at extreme simulated altitude. Journal of Applied Physiology 64(4):1309‐21.
Swenson ER, Maggiorini M, Mongovin S, Gibbs JS, Greve I, Mairbäurl H, Bärtsch P. 2002. Pathogenesis of high‐altitude pulmonary edema: inflammation is not an etiologic factor. The Journal of the American Medical Association 287(17):2228‐35.
Wagner PD. 2000. Reduced maximal cardiac output at altitude‐mechanisms and significance. Respiration Physiology 120(1):1‐11.
West JB. 1998. High life: a history of high‐altitude physiology and medicine. New York, Oxford University Press.
West JB, Boyer SJ et al. 1983. Maximal exercise at extreme altitudes on Mount Everest. Journal of Applied Physiology 55(3):688‐98.
West JB and Mathieucostello O. 1995. Stress Failure of Pulmonary Capillaries a Limiting Factor for Maximal Exercise. European Journal of Applied Physiology and Occupational Physiology 70(2):99‐108.
West JB and Wagner PD. 1980. Predicted gas exchange on the summit of Mt. Everest. Respiration Physiology 42(1):1‐16.
Westerterp KR, Kayser B, Brouns F, Herry JP, Saris WH. 1992. Energy‐Expenditure Climbing Mt Everest. Journal of Applied Physiology 73(5):1815‐1819.
Wilson MH, Edsell ME, Davagnanam I, Hirani SP, Martin DS, Levett DZ, Thornton JS, Golay X, Strycharczuk L, Newman SP, Montgomery HE, Grocott MP, Imray CH; Caudwell Xtreme Everest Research Group.. 2011. Cerebral artery dilatation maintains cerebral oxygenation at extreme altitude and in acute hypoxia‐an ultrasound and MRI study. Journal of Cerebral Blood Flow and Metabolism 31(10):2019‐2029.
Wolfel EE, Groves BM, , Brooks GA, Butterfield GE, Mazzeo RS, Moore LG, Sutton JR, Bender PR, Dahms TE, McCullough RE. 1991. Oxygen‐Transport during Steady‐State Submaximal Exercise in Chronic Hypoxia. Journal of Applied Physiology 70(3):1129‐1136.
Meet the Authors
Phil N. Ainslie: School of Health and Exercise Sciences, University of British Columbia Okanagan Campus, British Columbia, Canada

Phil Ainslie, PhD (UK), FACSM
Phil studied human physiology in the UK before post-doctoral studies at the University of Calgary. He started his first appointment as a Lecturer in Physiology at the University of Otago (New Zealand) in 2015 before moving to his job at UBC, Okanagan Campus in 2009. He is a full Professor and holds a Canada Research Chair in Cerebrovascular Physiology. In addition to lab-based work, Phil has led over 12 high-altitude research expeditions. He has published over 300 peer-reviewed publications in the area of environmental physiology. In his spare time, Phil stays active with his family and attempts to climb, ski and kite-surf as much as possible.
Joseph Donnelly: Department of Medicine, University of Auckland, New Zealand

Joseph Donnelly; PhD (Cambs), MB ChB (Distinction), BMedSc (hons)
Joseph studied medicine and physiology at the University of Otago, New Zealand. During his medical studies he developed an interest in high altitude physiology and performed research as part of multiple high-altitude research expeditions in the Nepal Himalaya and the Peruvian Andes. Joseph then completed his PhD in brain physics at the University of Cambridge, (United Kingdom) focussing on invasive monitoring of severe traumatic brain injured patients. Joseph is currently completing internal medicine training in Auckland, New Zealand, and is an honorary senior lecturer in Anaesthesiology. In his spare time, Joseph enjoys playing the bassoon and running slowly.
