
Chapter 17: The Child: Responses and Adaptations to Physical Activity and Training
Panagiota (Nota) Klentrou and Bareket Falk

Learning Objectives
After reading this chapter, you will be able to:
- Understand the rationale and methods used in scaling physiological responses to body size;
- Describe the integrated physiological responses to aerobic activity and endurance training in children and adolescents;
- Describe the physiological responses and adaptations to intense activity and recovery from intense exercise in children and adolescents;
- Describe the physiological responses and adaptations to resistance training in children and adolescents;
- Describe the thermoregulatory responses of children during exercise in the heat;
- Summarize the effects of physical activity on bone strength during childhood and adolescence;
- Discuss the interactions between training and normal growth and development.
Key Terms
aerobic exercise, allometric scaling, anaerobic performance, central (or cardiac) response, development, endurance training, growth, maturation, morphological adaptations, muscle composition, strength, neurological adaptations, neuromuscular activation, oxygen uptake, peak bone mass, peripheral (or vascular) response, puberty, recovery, ratio standards, resistance training, thermoregulation.
Introduction
This chapter describes the responses and adaptations of children to exercise and training. The pattern of these responses, for the most part, is similar to that of adults. The magnitude of these responses, however, may differ due to the effects of growth and maturation on body structures, and differences in body size and proportions. Physiologically, children are not small adults. This chapter highlights the quantitative and qualitative differences between children and adults in their responses to acute exercise and to aerobic training, including cardiovascular, pulmonary and metabolic changes. It then discusses the responses to anaerobic activity and resistance training from both the metabolic and neuromuscular perspective, highlighting new issues related to children’s neuromuscular activation and motor unit recruitment. The child-adult differences in the physiological responses during exercise in the heat, and their implications are also discussed. Special attention is paid to the effects of athletic training on growth, and the positive effects of exercise on bone accretion in children and adolescents.
____
Case Presentation
Rachel has lived her whole life in Vancouver. She learned in elementary school that she could run better than most of the boys. This information provided her with sufficient motivation to pursue a career in long distance running. She has never tried any other sport. She has competed internationally, representing Canada, for the past 12 years. Last year, she returned to her goal of completing university. She is studying Kinesiology at UBC. While in University she volunteered to participate in a study that compared the physiological responses to moderate, prolonged exercise between girls and women of similar fitness level. Rachel was matched in terms of fitness (size-adjusted maximal aerobic capacity) with Anna, an 11 years old girl, and both were asked to run for 30 min on a treadmill at a constant speed of 8 km∙hr-1. The results indicated that Rachel’s average rate of oxygen consumption during the run was higher than Anna’s (1.5 L∙min-1 versus 1.3 L∙min-1, respectfully), reflecting that Rachel used more energy to run at the same speed as Anna. However, Anna was the one who had trouble completing the exercise bout. Her heart rate was higher, and her breathing was much “harder”. Apparently, Anna was working a lot harder than Rachel. That is, at same submaximal speed, Anna was working much closer to her maximal oxygen uptake. There is an easy explanation for these results. When the results were adjusted to reflect the difference in body mass, Rachel’s energy cost of running was 1.09 kcal∙km-1∙kg-1, corresponding to 40% of her maximal oxygen uptake while Anna was using energy at a normal rate for a young female runner (1.7 kcal∙km-1∙kg-1) corresponding to 77% of her maximal oxygen uptake. This speed of running would be an easy jog for Rachel, but a difficult challenge for Anna.
In the above example, a child and an adult were asked to complete an identical task. Although both individuals were considered good runners, the child had difficulty completing the task, while the adult completed it without any trouble. This example illustrates that when examining the physiological response to exercise in children and adults, size differences must be taken into account.
____
Accounting For Differences In Body Size
Children’s response to exercise differs from that of adults largely, although not only, because of this size difference. This chapter highlights the child-adult differences in the response to exercise, which are beyond that due to differences in body size. But in order to do that, one must somehow account for size differences. That is, in order to adequately compare the physiological response to exercise between children and adults, or longitudinally during growth and development, one must “normalize” for variation in body size.

There are different approaches to account for differences in body size but unfortunately, there is no one ideal, optimal or “correct” method. The method used will depend on the question asked.
The most commonly used approach to scaling in pediatric exercise physiology is the ratio standards. Its common use is attributed mainly to its simplicity. That is, the physiological variable of interest (e.g.,V̇O2peak), is divided by a measure of body size (e.g., mass). A variety of anthropometric measures of body dimensions have been used as the denominator in ratio standards. For example, when comparing aerobic capacity between individuals of different sizes, body mass is often used in the denominator of (see case above). However, when comparing aerobic capacity between lean and obese individuals, it is preferable to use fat-free mass as the denominator, because the extra body does not contribute to oxygen uptake. Jumping ability is determined mainly by leg power. Therefore, when comparing jumping ability between individuals of different body size, body mass is often used as the denominator for leg power. However, when comparing strength between individuals, it is preferable to express strength relative to muscle cross-sectional area (see Section on strength later in this chapter). Body surface area is often used when adjusting metabolic rate for body size. The rationale for this is related to thermoregulation. That is, since animals of widely differing body size are characterized by the same body temperature, and since body heat loss is related to body surface area, it makes sense to relate resting metabolic rate, which controls body heat production, to body surface area (see section on thermoregulation later in this chapter). Likewise, the cardiovascular measures (cardiac output and stroke volume) have also traditionally been expressed relative to body surface area. This approach is based on empirical data of the cardiovascular response to exercise in children, although its biological rationale is not clear (see section on cardiovascular response later in this chapter).
Ratio standards, while simple to use and to conceptualize, are arguably, not always appropriate. The underlying assumption in using ratio standards is that the physiological variable of interest is linearly related to the denominator. Often, this is not the case (see (Rowland, 2005)(Nevill, 1997; Welsman and Armstrong, 2008) for details). Allometric scaling is recommended when the physiological variable of interest is related to body size in a non-linear fashion. For example, Welsman and Armstrong (2000) demonstrated that in their sample of children, V̇O2peak was related to body mass to the of 0.66 (mass0.66), rather than to mass to the of 1 (mass1), which is the commonly used normalizing factor. Allometric scaling involves using the equation Y=aMb, where a is the physiological variable of interest, M is the body dimension (e.g., mass), and b is the scaling exponent. Y is the normalized physiological variable of interest. The main limitation of allometric scaling, besides its mathematical and conceptual complexity relative to ratio standards, is the fact that scaling exponents for a given physiological variable calculated in different data sets vary widely. For example, empirically derived scaling exponents for VO2peak in children vary from 0.37 to 1.07, depending on the sample size, body composition, training status, etc. (Rowland, 2005). Moreover, it is not clear what exponent actually reflects the “true” biological relationship between VO2peak and body mass. Therefore, while the use of allometric scaling in pediatric exercise physiology is increasing, the use of ratio standards is still prevalent. The optimal way to account for, or “normalize” for body size is yet to be determined. Therefore, for the most part, ratio standards are used in order to compare between children and adults. The body dimension used in the denominator varies in accordance with the physiological variable and the question of interest.
Aerobic Exercise and Training
Aerobic exercise Aerobic exercise and endurance training have long been associated with multiple health-related physiological outcomes in adults. It is assumed that in children, as in adults, aerobic exercise is associated with short- and long-term health outcomes. Therefore, the physiological responses to prolonged exercise and to aerobic training in children are of particular interest. Generally, the pattern of responses and adaptations to aerobic exercise and training in children are similar to those of adults. The magnitude of these responses is, however, different due to the effect of growth and maturation of body structures, and differences in body size. This section presents the main physiological responses associated with aerobic activities, highlighting the differences in response between children and adults.
Cardiovascular Responses
The role of the cardiovascular system during exercise is to deliver blood to the working muscles, providing O2 and removing CO2 from the muscles, transporting nutrients and hormones, retaining osmotic and acid-base balance and regulating the body’s core temperature (see Chapters 9 and 11). Traditionally, the cardiovascular response to exercise has been studied via the Fick equation:
Where V̇O2 is the rate of oxygen uptake, Q̇ is the rate of cardiac output, which is determined by the stroke volume (SV) and heart rate (HR), and (a-v̅)O2 is the arterio-venous oxygen difference. The central (or cardiac) response is reflected by changes in Q̇, SV, and HR, while the peripheral (or vascular) response at the level of the tissue is reflected by changes in (a –v̅)O2 difference. The central and peripheral factors determining V̇O2 have been previously described in detail in the commentary by Bassett and Howley (Bassett and Howley, 2000).
In children, as in adults, all components of the Fick equation increase during exercise, reflecting the fact that as exercise intensity increases, the body makes central and peripheral adjustments in order to supply its energy needs. However, the magnitude and the rate of change in the cardiovascular response differ between children and adults.
Cardiac Response
In an elegant study by Turley and Wilmore (Turley and Wilmore, 1997), children’s cardiac response to different exercise intensities was compared to that of adults. This study demonstrated that at an exercise intensity requiring a given
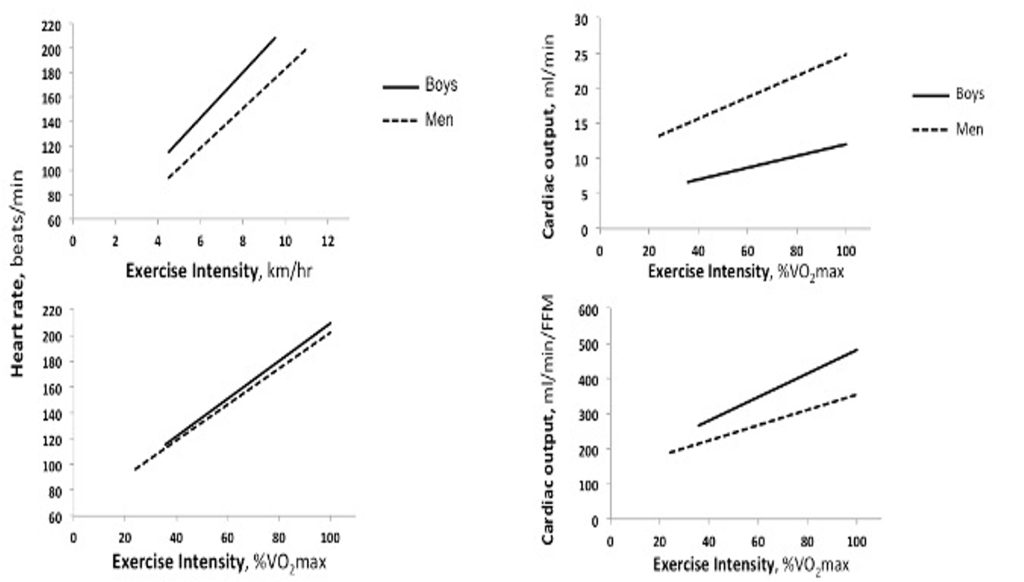
On the other hand, it is also important to understand the comparative responses of children during a given absolute (e.g., running at 8 km∙hr-1) versus relative (e.g., 60% of V̇O2max) exercise intensity. As can be seen in Figure 17.1a, as exercise intensity increases, heart rate increases in both children and adults. Importantly, at any given absolute exercise intensity, children’s heart rate is higher compared with adults. For example, at 10 km∙hr-1, a young man’s heart may beat at 180 beats∙min-1, whereas a 9 year-old boy’s heart may beat at close to 200 beats∙min-1. Likewise, children’s maximal heart rate is also higher compared with adults. For example, it is not uncommon for children to reach a heart rate >200 beats∙min-1 during very intense exercise. In adults, on the other hand, an observation of such a high heart rate is quite rare. Figure 17.1b demonstrates that if children and adults are running at the same relative intensity, the difference in heart rate is very small. For example, at an exercise intensity of 80% V̇O2max ( vigorous intensity), children’s heart rate is just slightly greater than adults’ (e.g., 180 vs. 174 beats∙min-1). The implication of this age-related difference is that if heart rate is to be used as an indicator of exercise intensity, as is often recommended for adults, one must keep in mind that for children, the targeted heart rate, as well as the heart rate at a given relative exercise intensity would be higher.
With the increase in exercise intensity, there is also an increase in stroke volume. However, unlike the linear increase in heart rate, stroke volume increases from rest to moderate intensity exercise (about 50% of maximum workload) and plateaus thereafter. This appears to be the case in both children and adults, although, of course, in view of children’s smaller body size, and, thus, their smaller left ventricular mass (LVM), stroke volume is much lower in children. Indeed, any increases in body size with growth are accompanied by increases in the size of the heart, particularly, LVM. These increases are associated with the enhanced stroke volume observed with growth and (Daniels et al., 1995; de Simone et al., 1998; Dekkers et al., 2002).
Cardiac output, which is the product of heart rate and stroke volume, increases linearly with exercise intensity, in both children and adults (Figure 17.1c). At any given exercise intensity, a child’s cardiac output will be much lower than an adult’s. For example, in the case of Anna and Rachel, while running at 8 km∙hr-1, Anna’s cardiac output was 11.5 L∙min-1, while Rachel’s cardiac output was 18 L∙min1. Even when running at the same relative intensity, children’s cardiac output is lower than that of adults. For example, in a study comparing 7 year-old boys with young men, while running at about 55% of V̇O2max, the boys’ cardiac output was about 8.5 L∙min-1, while that of the men’s was about 19.3 L∙min-1 (Figure 17.1c) (Turley and Wilmore, 1997). However, as is the case for stroke volume, cardiac output at rest and during exercise is also size-dependent. Therefore, child-adult comparisons require size adjustments. Traditionally, the cardiac response is adjusted to body surface area, resulting in stroke index (ml∙beat-1∙m–2) or cardiac index (ml∙min-1∙m–2). Indeed, when cardiac index is considered, there are no appreciable differences between children and adults exercising at moderate to vigorous intensity (Drinkwater et al., 1977; Rowland et al., 2008). The reasoning for adjusting the cardiac response to body surface area likely relates to the thermoregulatory perspective. That is, cardiac output and blood supply to the periphery (to the skin) are instrumental to maintain body temperature, especially at rest (see section on thermoregulation). On the other hand, it may be argued that cardiac output and blood supply is also necessary for the proper functioning of all organs, specifically, working muscles during exercise. Hence, some researchers believe that, during exercise, the cardiac response should be adjusted to body mass, or fat-free mass (reflecting muscle mass). When cardiac output is related to the fat-free mass, children’s cardiac output is higher than that of adults’, at any given relative exercise intensity (Figure 17.1d). For example, in the study by Turley and Wilmore (1997), while running at 55%
In summary, similar to adults, children’s cardiac output increases with increasing intensity of exercise, in proportion with the increase in stroke volume and heart rate. These responses reflect the increase in V̇O2 (Fick equation).At a given exercise intensity, as well as during maximal exercise intensity, children display higher heart rate lower absolute stroke volume and lower absolute cardiac output. The lower cardiac output does not necessarily denote cardiac insufficiency. Rather, when adjusted for body size, no appreciable differences in cardiac output are observed between children and adults (Vinet et al., 2002). Therefore, from the perspective of the physiological cardiac response, despite their smaller size and different activity habits, children are not disadvantaged in the performance of aerobic activities.
Peripheral Vascular Response
In accordance with the Fick equation, the peripheral response to exercise is reflected in the arterio-venous oxygen difference. In other words, in the amount of oxygen extracted from the blood by the working muscles ((a –v̅)O2 difference). This section discusses age-related differences in (a –v̅)O2 difference, which are dependent on blood flow to working muscles (vascular response) and on muscle enzymatic activity. Age-related differences in the vascular response, namely blood pressure and total peripheral resistance, are also discussed in this section. Muscle enzymatic activity is discussed later in the chapter.
During exercise there is an increase in blood flow to exercising muscles, cardiac muscle and skin, while there is a decrease in blood flow to internal organs and non-exercising muscles. Similar to adults, the blood flow redistribution in children facilitates greater oxygen transport to active muscle. The percent cardiac output that is directed to the exercising muscles appears to be higher in children than adults (Koch, 1980; Leclair et al., 2012). Specifically, Koch (Koch, 1980) showed that post-exercise blood flow to the vastus lateralis was greater in children than young adults. When the same children were tested 1 and 4 years later the difference had decreased, indicating maturation towards the adult response to blood flow distribution (Koch, 1980). These findings have been supported by Pichler et al. (Pichler et al., 2004), who demonstrated that forearm blood flow at rest decreased with increasing age (from 7 to 17 years old).
Furthermore, at an exercise intensity requiring a given V̇O2, children also demonstrate slightly greater (a-v̅)O2 difference than adults. This may be attributed to the fact that a greater proportion of their cardiac output goes to the exercising muscles, although disparity in muscle enzymatic activity may also affect (a-v̅)O2 difference. During submaximal exercise, children’s higher (a-v̅)O2 difference partially compensates for their lower cardiac output (relative to adults).
At rest, both diastolic and systolic blood pressure is lower in children than in adults (Paradis et al., 2004). During dynamic aerobic exercise there is an increase in the systolic blood pressure but no change in diastolic blood pressure. This response pattern is similar in children and adults (Rowland and Whatley Blum, 2000). The magnitude of increase in systolic blood pressure depends on the intensity of exercise with no apparent differences between children and adults. A possible exception to the latter may occur during high intensity static exercise (e.g., isometric or 1RM lifting), during which the increase in systolic blood pressure is less in children compared with adults (Turley et al., 2002).
Total peripheral resistance (TPR) is directly proportional to mean arterial blood pressure (MAP) and inversely proportional to cardiac output.
TPR = MAP∙Q̇-1 Equation 17-2
During exercise, total peripheral resistance decreases, due to vasodilation in working muscles. While this response is similar in children and adults, the absolute TPR is higher in children at any absolute or relative exercise intensity, reflecting their smaller blood vessels. However, it should be remembered that TPR during exercise should be related to the blood supply in the working muscles. Thus, at a given relative exercise intensity, when TPR is scaled to muscle mass, TPR is lower in children compared with adults (Rowland and Whatley Blum, 2000; Turley and Wilmore, 1997). The implication of this lower TPR, is that at a given relative work rate, muscle blood flow is higher in children.
In summary, during aerobic exercise, children demonstrate a lower blood pressure response and lower size-adjusted total peripheral resistance. Their (a-v̅)O2 difference is somewhat higher during submaximal exercise. Therefore, in terms of the peripheral vascular response children are certainly not disadvantaged in the performance of aerobic activities, and in fact, may even have a slight advantage.

Pulmonary Responses
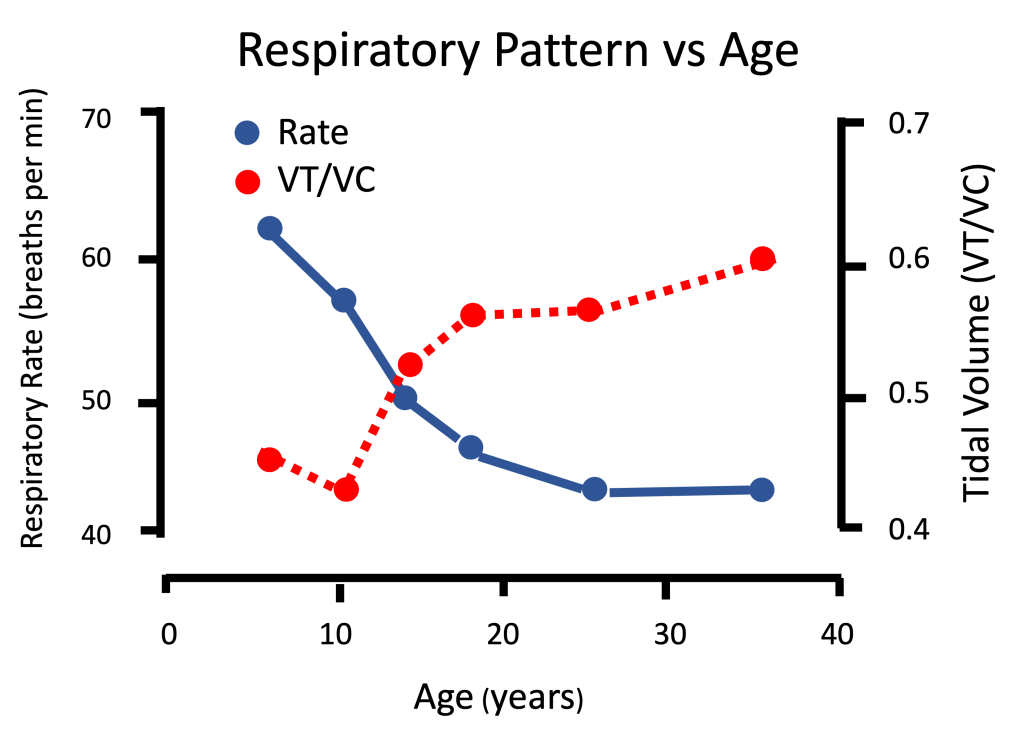
Pulmonary ventilation (V̇E), or the amount of air flowing in and out of the lungs every minute, is lower in children compared with adults at rest and during a given exercise intensity. However, when V̇E is adjusted to body size (for example, per body mass), girls exhibit a higher ventilatory response compared to women during submaximal and maximal exercise (Rowland and Green, 1988). This could also be assumed for boys since pre-pubertal girls are of similar size and pulmonary response as boys. This higher size-adjusted V̇E is due to age-related differences in the airways. That is, gas exchange takes place in the alveoli. Therefore, all airways leading to the alveoli do not serve in gas exchange and are therefore termed anatomical dead space. In children, the length (or volume) of these airways, where no gas-exchange occurs, is greater relative to the volume of the alveoli, when compared with adults.
Due to their greater relative anatomical dead space, children’s fast breathing is considered relatively shallow. In terms of the measured lung volumes and capacities, this means that the percentage of vital capacity used in each breath (tidal volume) is lower in children, making their breathing pattern inefficient. This breathing inefficiency is reflected in children’s lower tidal volume and higher breathing rate at any given submaximal load (Mercier et al., 1991; Rowland and Cunningham, 1997). Importantly, this means that during exercise, the amount of air needed to breathe in and out in order to supply the body with a given volume of oxygen (the ventilatory equivalent, V̇E∙V̇O2-1) has been found to be greater in children than in adults (Macek and Vavra, 1985). Other studies (Rowland and Green, 1988) also found higher V̇E/V̇O2, and thus, inferior breathing efficiency during submaximal running (at a given speed), in girls compared to women. In other words, there is some evidence that the cost of breathing in children is higher than in adults. During exercise, the cost of breathing adds to the cost of exercise. That is, at any given exercise intensity, this higher cost of breathing contributes to the higher oxygen cost (orV̇O2) observed in children compared with adults. This is especially apparent during locomotion-type of exercise (Bar-Or and Rowland, 2004).
The ventilation determines the gas exchange in the lungs. Despite their lower breathing efficiency, children’s ventilation is higher than adults’, at any given exercise intensity (Rowland and Cunningham, 1997). This higher ventilation may be due to a lower CO2 threshold drive for respiration. Importantly, children’s higher ventilation is beneficial for clearing of CO2 during exercise.
In summary, compared with adults, children demonstrate an exaggerated ventilatory response to a given metabolic rate, likely due to differences in airway dimensions or proportions, resulting in inefficient breathing (Gratas-Delamarche et al., 1993). Despite their inefficient ventilation, children’s ventilation is greater than adults’, allowing them to benefit from greater gas exchange during exercise.
Aerobic Capacity
Aerobic capacity is a multifactorial quality. The indicators of aerobic capacity include: maximal aerobic (V̇O2max), endurance performance, time to exhaustion, and lactate or ventilatory threshold. Amongst those, maximal aerobic is the most often used indicator of aerobic capacity in both children and adults. There are many factors that determine the
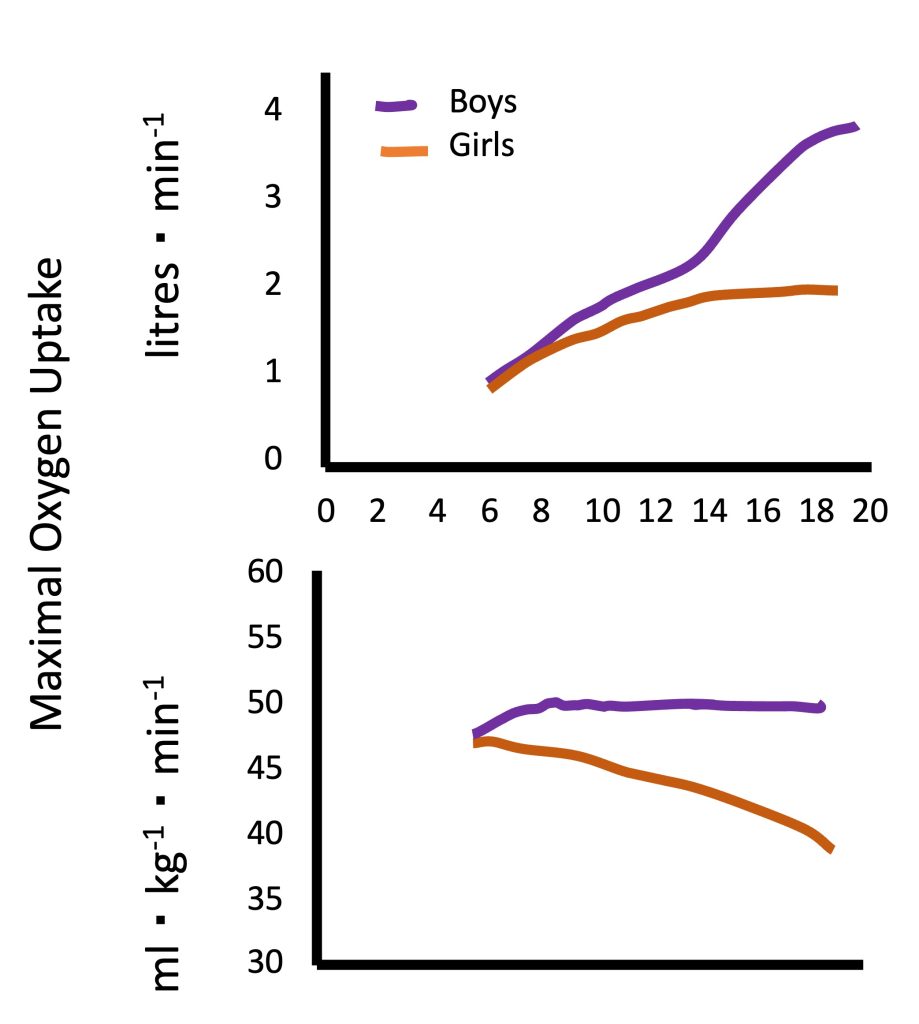
Absolute V̇O2max (in L of oxygen per minute) increases during growth and (Figure 17.3a). For example, a “typical”V̇O2max for a healthy young man may be 3.5 L∙min-1. For a 10 year-old healthy boy, a “typical” V̇O2max may be 1.4 L∙min-1. This age-related difference reflects the differences in body size and specifically, in the exercising muscle mass.
While there are no available “normal values” forV̇O2max in children, due to differences in measurement protocols used in different studies, numerous studies have demonstrated an increase in V̇O2max with an increase in age. In boys, this increase appears to be linear. However, in girls, V̇O2max appears to increase linearly until the age of 12-14 years, at which time it plateaus until young adulthood (Figure 17.3a). This pattern is evident in the many cross-sectional studies, as well as in the few longitudinal studies conducted on this topic in Europe and North America (Malina et al., 2004). At every age, boys V̇O2max is higher than girls’, with the difference increasing as boys and girls get older. The apparent sex-related difference in V̇O2max among young children is a reflection of boys’ larger heart size (specifically, LVM), resulting in higher stroke volume and cardiac output. As children mature, specifically during the pubertal period, the disparity in hemoglobin content and muscle mass between boys and girls increases. This is reflected in the increasing sex-related difference in V̇O2max with increased age.
Since V̇O2 is largely dependent on the size of the active muscle, V̇O2max is usually adjusted for body mass. Size-adjusted V̇O2max, expressed in mL of oxygen·kg-1·min-1 does not change with increasing age in boys, while in girls, V̇O2max decreases, particularly after the age of 12-14 years (Figure 17.3b). In other words, in males, maximal aerobic capacity, relative to body mass, does not differ between boys and men. Typical V̇ O2max values for healthy, normally active boys and men are 45-50 mL∙kg-1 ∙ min-1. In females, girls exhibit higher V̇ O2max compared with women. Part of the explanation for this age-related difference is the fact that women have a higher percentage of body (and a lower percentage of muscle mass), compared with girls. This difference in body composition is not taken into account when adjusting
Metabolic Response –
Fuel utilization during exercise
During exercise, energy is supplied to the working muscles via aerobic and anaerobic metabolic pathways. As exercise intensity increases, there is a shift from aerobic to anaerobic metabolism (see Chapter 6). This shift in metabolism is often reflected by an accumulation of lactate in the blood above a certain exercise intensity, termed the lactate threshold (see Chapters 10 and 16). At any given relative exercise intensity (e.g., 50% of maximal aerobic power), as well as at maximal exercise intensity, the blood lactate concentration in children is lower than in adults. For example, in adults, the lactate threshold is said to occur around a blood lactate concentration of 4mM. While this value may vary among individuals, the equivalent threshold concentration in children is suggested to be around 2.5mM (Williams and Armstrong, 1991). More importantly, when expressed as a percentage of V̇O2max, the lactate threshold in children occurs at a higher percentage of maximal aerobic (%V̇O2max) compared with adults. For example, Anderson and Mahon (Anderson and Mahon, 2007) reported that among 9-10 year old boys, the lactate threshold occurred at 64% ofV̇O2max whereas in young adult men with similar aerobic fitness (similar V̇O2max), the lactate threshold occurred at 55% ofV̇O2max.
The determination of the lactate threshold requires invasive measurements. Therefore, the ventilatory threshold is often used to estimate the exercise intensity at which the rate of production of lactate exceeds the rate of removal (see Chapter 10). As is the case with the lactate threshold, the ventilatory threshold is also reported to occur at a higher percentage of V̇O2max in children compared with young adults. For example, Klentrou et al. (Klentrou et al., 2006) reported that 10-11 years old boys had higher ventilatory threshold than the adults (65% versus 58% of V̇O2max) of similar V̇O2max. Similarly, in the study by Anderson and Mahon (Anderson and Mahon, 2007), boys’ ventilatory threshold occurred at 68% of V̇O2max, compared with men’s 59% of V̇O2max.
Recall that one of the differences between aerobically trained and untrained individuals is the higher lactate threshold in the former (see Chapter 10). Along these lines, it may be argued that children’s higher lactate threshold may indicate an ability to rely on aerobic metabolism at higher intensities of submaximal exercise.
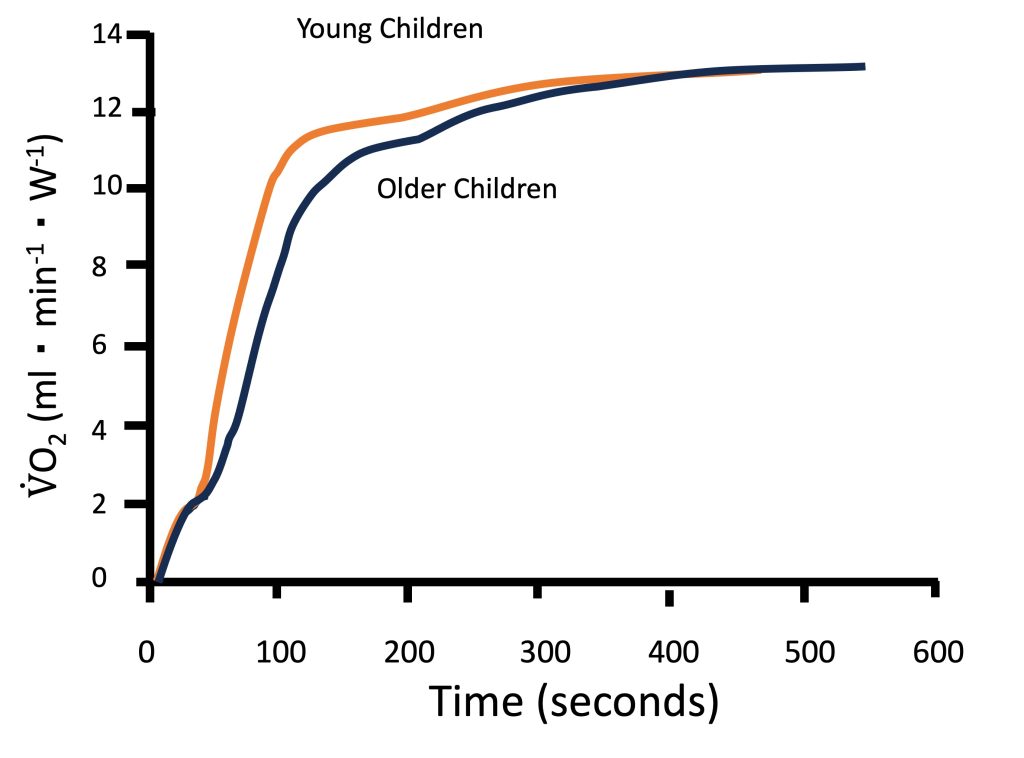
Metabolic control at the muscle level is often studied non-invasively using V̇O2 kinetics at the onset of exercise (see Chapter 10). Indeed, as illustrated in Figure 17-4, children have been shown to have faster V̇O2 kinetics at the onset of intense exercise compared with adolescents and young adults (Armstrong and Barker, 2009; Fawkner and Armstrong, 2004). These findings reflect a greater reliance on oxidative energy pathways, resulting in lower accumulation of metabolic by-products, such as lactate. Therefore, the fasterV̇O2 kinetics observed in children are consistent with the observation that their lactate and ventilatory thresholds occur at a higher percentage of V̇O2max.
Magnetic resonance technology has also been used to investigate muscle metabolism non-invasively. Using this technology, exercise scientists (Ratel et al., 2008) studied the kinetics of phosphocreatine resynthesis after exercise and found that the rate constant of phosphocreatine recovery and the maximum rate of aerobic ATP production were about 2-fold higher in young boys than in men, indicating that muscle oxidative capacity was higher in children than in adults (see Chapter 10). Collectively, the findings described above of higher lactate and ventilatory thresholds, faster V̇O2 kinetics at the onset of exercise and faster post-exercise phosphocreatine kinetics all point to a greater reliance on aerobic metabolic pathways in children at any given relative exercise intensity. This reliance on aerobic, rather than anaerobic metabolism is instrumental for enhanced exercise endurance. Therefore, from a metabolic perspective, children appear to be more aerobically inclined compared with adults.A case in point is children’s fuel utilization during exercise. Recall that, among adults, endurance-trained athletes are typically able to rely more on fat, rather than on carbohydrate utilization during submaximal exercise. This adaptation to training is considered beneficial for endurance performance. Interestingly, during submaximal exercise of the same relative intensity (e.g., 60-70% V̇O2max), children, like endurance athletes, rely more on utilization and less on carbohydrates utilization, compared with adults (Martinez and Haymes, 1992; Timmons et al., 2003). In other words, among exercising children, lipid oxidation contributes relatively more to the total energy expenditure, compared with adults. For example, Timmons et al. (Timmons et al., 2003) demonstrated that during 60 min of cycling at a moderate-vigorous intensity (70% V̇O2max), oxidation contributed about 40% of the energy requirement for the boys, whereas for the men, only about 20% of the energy came from oxidation (Figure 17.5a). Riddell et al. (Riddell et al., 2008) demonstrated that the oxidation rate during a wide range of exercise intensities is higher in boys compared with men, and that the maximal oxidation rate decreases during puberty. Although the exact mechanisms for this age- or maturation-related change in substrate utilization are not well understood, the higher utilization during exercise has been linked to factors such as higher aerobic enzymatic (SDH) activity in muscle, higher mitochondrial volume or mitochondria/myofibrillar volume, greater intramuscular triglyceride deposits, or possibly, greater recruitment of type I fibres (vs. type II fibres) in children (see highlight box).
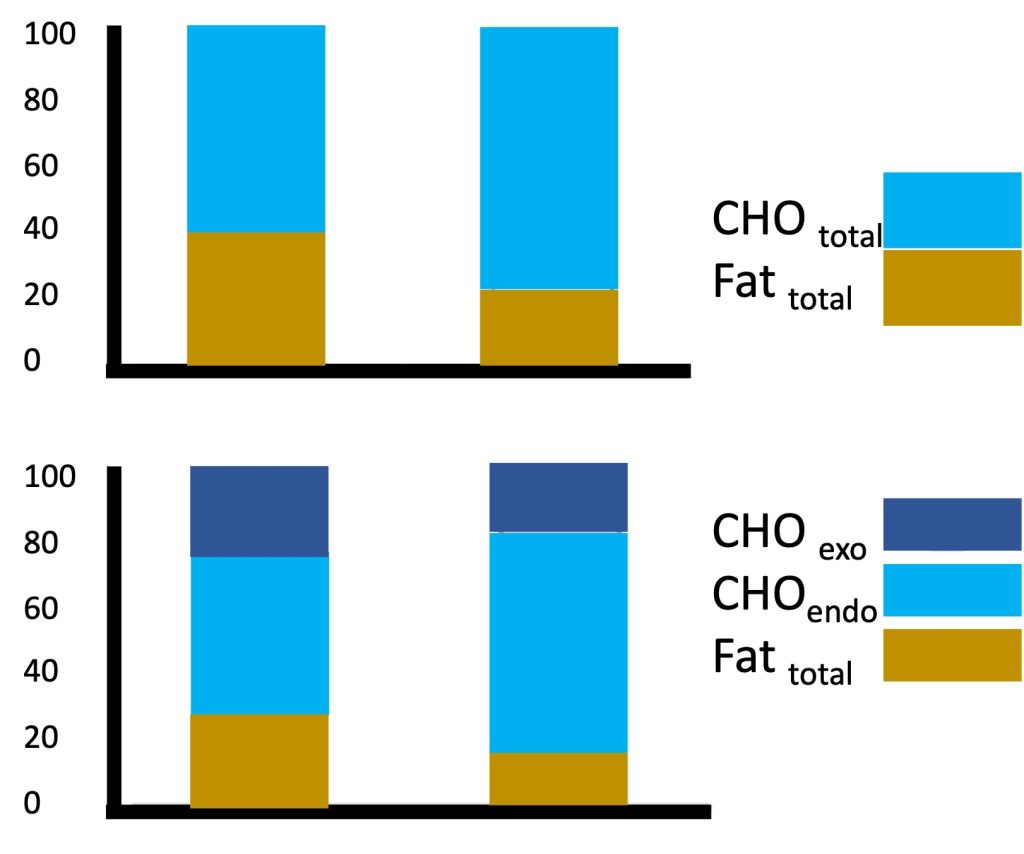
The greater reliance on oxidation in children was also apparent when a sports drink (containing carbohydrate) was consumed during exercise. Interestingly, the boys utilized more of the exogenous (i.e., ingested) carbohydrates for their energy needs, compared with the men (Figure 17.5b). That is, while consuming a sports drink, reliance on oxidation was still higher in the boys (30%) compared with the men (17%). However, the sports drink provided 22% of the energy for the boys during exercise and only 15% of the energy consumed by the men (Timmons et al., 2003). While the reason for the boys’ greater relative utilization of the carbohydrates from the sports drink is unknown, it may be beneficial in preserving the limited endogenous (i.e., stored within the body) carbohydrate stores in the muscle during prolonged exercise, ultimately enhancing endurance capability.
Highlight Box: The Differential Motor-Unit Activation Hypothesis
There are numerous performance outcomes in which children’s performance is inferior to adults. There are also numerous physiological responses to exercise, such as fatiguability during and after (recovery) intense exercise, glycolytic capacity, substrate utilization during aerobic exercise, the lactate response to incremental exercise, and neuromuscular adaptations to resistance training, which are quantitatively and qualitatively different in children compared with adults. Many of these differences, as outlined in this chapter, are only partially explained by body size differences. This means that there is another factor (or other factors), which must be considered in order to explain children’s differential response to exercise.
Canadian researchers have recently proposed that the one factor which is common to this wide array of performance and metabolic child-adult differences in the exercise response is related to age- or maturation-related changes in muscle activation (Dotan et al., 2012). Erling Asmussen, in the mid 1950’s observed that the increase in strength with increasing age is more than can be expected from an increase in body size. He postulated that children do not activate, or utilize their muscle to the extent typical of adults (Asmussen and Heeboll-Nielsen, 1955; Asmussen and Heeboll-Nielsen, 1956). Subsequently, numerous authors have provided indirect evidence of this quantitatively lower muscle activation in children (e.g., (Belanger and McComas, 1989; Grosset et al., 2008; O’Brien et al., 2010)). Based on Henneman’s size principle (Henneman et al., 1965), which states that with an increase in contraction intensity, there is an increase in recruitment of type-II muscle fibres, the differential motor unit activation hypothesis states that children’s muscle activation is not only quantitatively lower, but also qualitatively different from adults’ muscle activation. It is hypothesized that children are substantially less capable of recruiting or fully employing their higher-threshold, type-II motor units.
While there is abundant indirect evidence to support this hypothesis (see (Dotan et al., 2012) for detail), it has not been validated. Direct validation would require monitoring of muscle performance while simultaneously recording activation pattern of a large sample of individual motor-units. Presently, there is no appropriate technique to obtain such data.
The indirect evidence supporting the differential motor-unit activation hypothesis includes contractile and power related data, as well as EMG-derived data. Contractile and related data include much slower rate of force in children (Asai and Aoki, 1996; Cohen et al., 2010), along with slower kinetics during maximal contraction (Dotan et al., 2013). EMG-derived data include a slower rate of rise in at the beginning of an explosive contraction (Cohen et al., 2010), and a lower decrease in the mean power frequency during prolonged isometric contractions in children (Armatas et al., 2010; Halin et al., 2003). More recently, two studies demonstrated a higher relative in children compared with adults during progressive cycling to exhaustion (Long et al., 2017; Pitt et al., 2015). The reflects the onset of accelerated recruitment of type-II motor units. Thus, these studies suggest lesser type-II motor unit recruitment in children. Table 17.1 delineates a wide array of child-adult exercise performance and metabolic difference, highlighting those that can be explained by quantitatively lower muscle activation and those for which such an explanation would not be sufficient. In those cases, the differential motor-unit activation hypothesis may provide the explanation.
Table 17-1 Child-adult exercise performance and metabolic differences, and possible explanatory roles of age-related neuromuscular activation differences.
|
Children relative to adults (after correcting for differences in body size) |
Neuromuscular Activation-related Mechanisms |
|
|
Overall lower muscle activation |
Lower activation of type-II motor units |
|
|
Response to exercise or training: |
||
|
Lower maximal force |
√ |
√ |
|
Lower muscular power |
√ |
√ |
|
Slower force Kinetics |
—— |
√ |
|
Lower fatiguability/Higher endurance |
√ |
√ |
|
Faster recovery |
√ |
√ |
|
Slower rate of rise of EMG |
—— |
√ |
|
Non-hypertrophic response to resistance training |
—— |
√ |
|
Metabolic responses |
||
|
Lower peak blood lactate concentration |
√ |
√ |
|
—— |
√ |
|
|
Faster intra-cellular phosphocreatine recovery |
√ |
√ |
|
Greater utilization Lower carbohydrate utilization |
—— |
√ |
|
—— |
√ |
|
Adaptations to Aerobic Training
The question is often asked, how effective is aerobic training in increasing children’s V̇O2max and aerobic performance? Any change in V̇O2max is effected through central (cardiac) and/or peripheral (muscle) adaptations. Presumably, an enhanced V̇O2max, results in improved aerobic performance. This section discusses the physiological adaptations (central and peripheral) to aerobic training in children and the observed changes in V̇O2max and aerobic performance.
As previously discussed, V̇O2 is determined by cardiac output (stroke volume and heart rate) and by the arterio-venous oxygen difference. Young athletes have been shown to have higher maximal cardiac output, as well as higher blood volume, compared with untrained peers (Eriksson and Koch, 1973; Nottin et al., 2002b; Rowland et al., 1998). Others have shown increased stroke volume and a decreased heart rate during prolonged, submaximal exercise in endurance trained children (Obert et al., 1998). These are typical responses that would be seen in adults on an aerobic training program. However, it is possible that these cross-sectional studies reflect selection bias (genetic advantage), rather than true adaptations to training. That is, it is possible that the young athletes have genetically greater cardiovascular responses to exercise and that this is one of the reasons they were drawn to, and succeeded in endurance sports. There are very few intervention studies that have examined the cardiac or hemodynamic adaptations to endurance training in children. Some studies have shown that LVM increases as a result of endurance training in children, as it does in adults (Nottin et al., 2002a; Obert et al., 2003), enhancing stroke volume at rest and presumably also during exercise. Exercise training does not seem to have a significant impact on maximum heart rate, on arterio-venous oxygen difference or on total peripheral resistance in children, although there is very limited information on these responses in children.
Changes in left ventricular dimensions and stroke volume will result in increased maximal cardiac output and potentially, greater aerobic capacity. The magnitude of change in maximal aerobic capacity following aerobic training is influenced by genetics, the training program itself, and the interaction between these two factors. Among adults, the training effect on V̇O2max ranges between 0-50% (Bouchard, 1995), although a crude average improvement is about 20% improvement in V̇O2max. In children, numerous studies have investigated the effect of aerobic training on V̇O2max, but only few demonstrated more than 10% improvement. In fact, the crude average improvement in children is about 8% of V̇O2max, with many studies demonstrating no effect at all (Pfeiffer et al., 2008). The reason for the lower trainability in children is not clear. The most likely explanation is that, in most training studies the training program has been designed based on adult guidelines. For example, participants train 3 times per week, 45-60 minutes each session, at an intensity eliciting 75-80% of maximal heart rate. While these guidelines may be effective for adults they may be insufficient to stress the oxygen delivery system in children. That is, in view of the observed higher (lactate or ventilatory threshold) in children, as discussed previously, children may need to train at a higher relative intensity in order to elicit adaptations in the cardiovascular system. Indeed, those studies in which a higher training intensity was used (for example, HR>85% of maximal HR) demonstrated significant increases in
In spite of the relatively low training effect on V̇O2max in children, training does result in improved endurance performance. For example, following a training program, children will be able to complete a distance run in a shorter duration, even if V̇O2max does not increase. Possible reasons for this improved performance include better movement economy, improved “tactics” and higher anaerobic ability. Better movement economy is a bioenergetic term associated with the energy cost of locomotory activity. This energy cost is reflected in the O2 cost at a given submaximal speed, which is shown to be higher in children (Frost et al., 2002) than in adults. It is possible that following training, children’s running style becomes less mechanically “wasteful”, or more economical, resulting in the ability to perform at a greater speed for a given energy expenditure. Another possible explanation for children’s improved performance may be a “learning effect”. That is, children, through practice, learn how to pace themselves during prolonged exercise, thus being able to utilize better tactics to improve performance. Finally, every aerobic performance includes an anaerobic component. Long-distance races are characteristically ended by a “sprint to the finish”. Rotstein et al (Rotstein et al., 1986) demonstrated that in children, an aerobic training intervention will result in aerobic, as well as in anaerobic adaptations. Therefore, it is possible that the improved performance (shorter time) in prolonged exercise tasks (e.g., 5 km run), reflects, at least in part, improved anaerobic capacity.
Gender Box: Does Intense Training Alter Girls’ or Boys’ Growth and Maturation?
The increased involvement of young children in intense physical training over the past decades has generated concerns as to its potential effects on children’s growth, maturation, and reproductive function (Mansfield and Emans, 1993). These effects are potentially different for females than they are for males, especially around the time of puberty, when boys’ and girls’ hormonal status differ considerably. The pubertal period is associated with marked physiological and psychological changes, and important neuroendocrine adjustments that result in both physical maturation (i.e., skeletal and growth), and sexual maturation (growth of pubic hair, and in the genitalia). Thus, during the pubertal years, the hormonal milieu of an adolescent athlete undergoes developmental changes, as well as possibly, training-related adaptations (Klentrou, 2006).
Physiologically, puberty is a complicated series of events that are initiated by an increase in the secretion of gonadotropin releasing hormone (GnRH) from the hypothalamus. GnRH acts on the pituitary gland, stimulating the release of luteinizing hormone (LH) and follicle-stimulating hormone (FSH). In males, this causes increased release of testosterone from the gonads. Testosterone continues to increase throughout puberty until it reaches adult levels and plays a key role in both physical and sexual maturation (Rilling et al., 1996). In females, sufficient quantities of FSH and LH stimulate ovarian follicular development, the of secondary sex characteristics, and an increased release of female sex steroids (estrogen and progesterone) from the ovaries (Caufriez, 1991). Estrogen and progesterone continue to increase throughout puberty, and play a key role in both physical and sexual maturation (Hamm, 1991).
Early studies on team male athletes in popular sports (i.e., soccer, football and baseball) have demonstrated that elite athletes are more mature than their untrained peers, suggesting that physical training causes early onset of puberty in males (Cacciari et al., 1990; Hale, 1956). However, these results may be affected by sampling bias. In these sports, a greater physical size typically provides an advantage. Therefore, the more mature athletes are the ones that succeed and remain in the sport (Malina et al., 2000). In other words, it is not that elite training causes early maturation but rather, early maturing boys are more successful in these elite sports.
It can be argued that boys who participate in individual sports often train from an early age, thus providing a better model to examine the possible effects of physical training on pubertal development. In pubertal male swimmers, 43 weeks of training significantly decreased testosterone levels to below pre-training levels (Carli et al., 1983). Elite male gymnasts, on the other hand, have been found to be generally advanced in pubertal and skeletal development, despite their generally short stature (Buckler and Brodie, 1977; Moore et al., 2010). Others have shown that although the intense training by the young male gymnasts result in reduced body fat, there is no apparent alteration in the timing and extent of their physical and pubertal (Gurd and Klentrou, 2003). Thus, as with team sports, observations of early maturation in male athletes of individual sports are likely attributed to selection bias rather than training per se.
In females, numerous studies have suggested that intense gymnastic training may delay and even stunt growth (Georgopoulos et al., 2012; Peltenburg et al., 1984), due to altered hormonal (Theintz et al., 1994; Theintz, 1994). The altered hormonal milieu may result in delayed pubertal onset, delayed age at first menarche, and failure to develop mature skeletal structure (Malina, 1983). Although not supported by current opinion, low body has been cited as the reason for the delayed menstruation or menstrual cycle irregularities among elite female athletes (Frisch and McArthur, 1974). More recent studies have suggested that delayed menarche in elite gymnasts (and other athletes, such as dancers and figure skaters) may be due to genetic factors, and that late-maturing girls often self-select sports which require high relative strength and small bodies, such as gymnastics (Baxter-Jones and Helms, 1996; Loucks, 1995). Indeed, 37% of the variance in the age at menarche has been found to be attributed to genetic factors (Kaprio et al., 1995). On the other hand, a higher prevalence of menstrual dysfunction has been reported for adolescent athletes in leanness-dependent and weight-dependent sports, as compared with those in other sports (Klentrou, 2006). Despite the arguments for selection bias, there is at least one study which demonstrated stunted growth (shorter stature compared with predicted height) in young elite female gymnasts; however, they did not examine nutritional intake (Theintz et al., 1993). However, the available research supports the role of nutrition-related factors and energy balance, rather than the training intensity per se, in the etiology of exercise-associated menstrual irregularities or delayed growth in young female athletes (Klentrou, 2006). Future research should be longitudinal in nature in order to investigate the long-term effects of sport training, nutrition (fuel availability and utilization) and psychological stress, on the growth and maturation of young females.
Anaerobic Capacity and Recovery from Intense Exercise
As opposed to aerobic fitness, which is widely accepted to be reflected by maximal aerobic uptake (V̇O2max), there is no accepted physiological index of anaerobic fitness. Rather, anaerobic fitness is assessed via anaerobic-type performance. The most widely accepted test of anaerobic performance is the Wingate Anaerobic Test (WAnT) (see chapter 10). Also, unlike aerobic fitness, which is known to be related to health, anaerobic fitness, as reflected by peak or mean mechanical during short duration, high intensity exercise, is not specifically related to any health measure. Perhaps this is the reason for the much lower number of studies that have investigated anaerobic fitness or performance compared to aerobic fitness in children and adolescents.
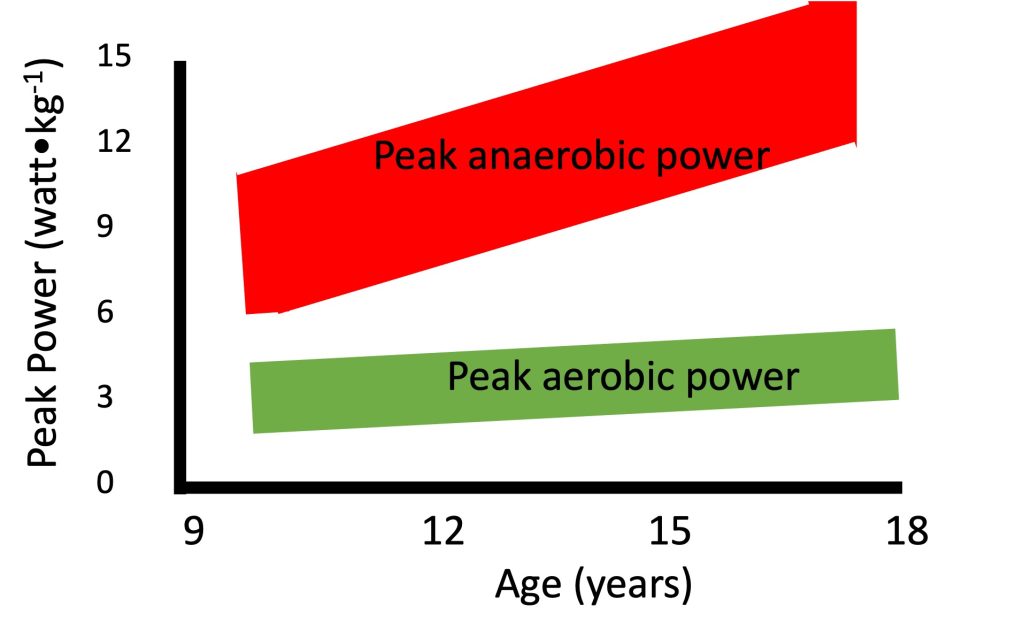
Anaerobic performance increases with growth and maturation. This increase has been demonstrated in numerous cross-sectional studies (e.g.,(Inbar and Bar-Or, 1986; Van Praagh and Dore, 2002)), as well as in few longitudinal studies (e.g. (Armstrong et al., 2001; Falk and Bar-Or, 1993; Martin et al., 2004)). For example, Van Praagh and Dore (Van Praagh and Dore, 2002), demonstrated such an increase in peak short-term in over 500 boys and girls between 7 and 21 years of age. Importantly, even after correcting for body size, the increase in anaerobic performance with age is readily apparent (Figure 17.6). Regardless of the manner in which body size is taken into account (e.g., body mass, height, muscle cross-sectional area), increases with growth and development. Thus, as opposed to maximal aerobic (but similar to strength, see section on strength), scaling for body size does not eliminate the age-related increase in maximal anaerobic power. Therefore, factors other than body size must explain the age-related increase in anaerobic power.
Factors Affecting the Increase in Anaerobic Power with Growth
There are numerous factors, other than body size, which may explain changes in anaerobic power. Similar to the factors affecting strength (see section on strength), possible increases in type-II fibres distribution, increases in musculotendinous stiffness, and/or possible decreases in co-contraction may result in enhanced anaerobic power. However, the most accepted and widely cited factor explaining the lower anaerobic performance in children compared with adults is the former’s “metabolic immaturity”. Several studies have demonstrated lower activity in enzymes which are central to anaerobic metabolism, including phosphofructokinase (PFK, (Eriksson, 1980; Eriksson et al., 1973)) and lactate dehydrogenase (LDH, (Kaczor et al., 2005). Indeed, rate of lactate production in the muscles during exercise has been shown to be lower in children compared with adults. Furthermore, the rate of muscle glycogen utilization during intense exercise has been shown to be much lower in children compared with adults (Eriksson et al,. 1971). Therefore, it is believed that enhanced enzymatic activity, especially during adolescence, is at least partly responsible for the increased anaerobic performance seen during this period. It is still unclear however, what is the reason behind the changes in enzymatic activity. We have recently proposed that these changes may be a reflection of increased utilization of type-II motor units, which is hypothesized to occur with growth and (see highlight box).
It is interesting to note that while maximal aerobic does not change with growth, specifically in boys, maximal does, even when corrected for the increases in body size. This difference in pattern of change is illustrated in Figure 17.6. In a mixed-longitudinal study, Falk and Bar-Or (Falk and Bar-Or, 1993) describe the increase that occurred in peak anaerobic power, as determined in the WanT, among 36 pre- to late-pubertal boys. At the same time, there was no change in the maximal aerobic in these boys. For example, while boys’ maximal mechanical on a cycle ergometer at the end of a maximal progressive aerobic test remains about 4 watts∙kg-1 as they grow, their peak anaerobic power, as determined by the Wingate Test, can increase from 9 watts∙kg-1 at 10 years, to over 14 watts∙kg-1 at 18 years. The authors suggested that metabolic specialization occurs during puberty, possibly as a result of increased utilization of type-II motor units (see highlighted box).
Recovery from Intense Exercise
Recovery from intense exercise is notably faster in children compared with adults. That is, following intense exercise, boys are able to repeat their output within a shorter period of time compared with men (Hebestreit et al., 1996; Ratel et al., 2002; Ratel et al., 2004; Zafeiridis et al., 2005). From a methodological perspective, it is difficult to determine whether children’s physiological recovery, that is, the return to homeostasis, is also faster than adults’. For example, as discussed earlier in this chapter, maximal heart rate, an indicator of cardiovascular stress, is higher in children than in adults. On the other hand, blood lactate concentration, an indicator of metabolic stress, is lower in children than in adults. Further complicating the comparison is that resting levels (e.g., heart rate) may also differ between children and adults. Therefore, it may be argued that children and adults do not recover from the same level, nor do their physiological responses need to return to the same level. One approach has been to examine net changes in the physiological response to exercise (e.g., heart rate, ventilation, RER). Using this approach, Hebestreit et al. (Hebestreit et al., 1996) demonstrated that following the WAnT, children’s physiological response recovers faster. Another approach is to match post-exercise values. For example, by using a variable duration WAnT, Dotan et al. (Dotan et al., 2003) matched post-exercise blood lactate levels in men and boys. The authors demonstrated that although the rate of disappearance of blood lactate was similar in the two groups, blood lactate concentration peaked earlier in the boys, thus allowing them to begin their recovery process earlier.
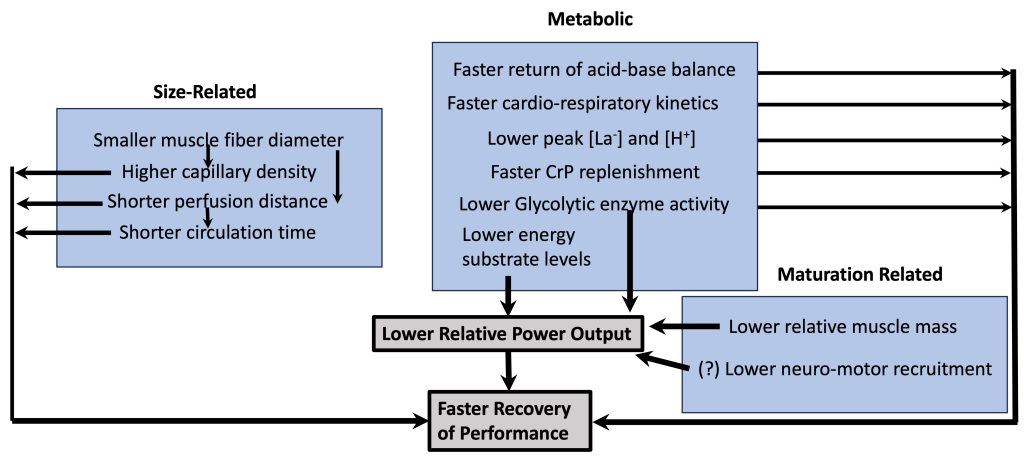
Part of the explanation for children’s faster recovery is that their maximal output is lower than adults’ (see above). Therefore, for children, there is less disturbance to homeostasis during exercise so they have ‘less to recover from’ (Falk and Dotan, 2006). Children have a lower proportion of muscle mass. Additionally, their lower output may be a result of a lower utilization of the higher-threshold, more powerful motor units (see highlight box). However, there are other child-adult differences, which may result in faster recovery of performance (Figure 17-7). Some of these differences are simply related to differences in body size, some are metabolic differences and some are qualitative differences related to maturation. For example, children’s muscle fibres are smaller in diameter. That means that the diffusion distance of metabolites from the muscle fibre to the blood is shorter. This shorter distance, along with presumed greater capillary density around the muscle fibre, allows metabolites to clear from the muscle faster in children. Likewise, children’s shorter circulation distance means that metabolites (e.g., lactate) can be dispersed (e.g., get to inactive muscle, where they can be metabolized) within a shorter time period. From a metabolic perspective, children’s faster oxygen kinetics (Armstrong and Barker, 2009; Willcocks et al., 2010), along with their lower concentration of metabolites in the blood (lactate, H+) also directly results in faster recovery. Thus, children’s faster recovery, in terms of performance, as well as the physiological response is due to quantitative and qualitative reasons.
Muscle Strength and Resistance Training
Ironically, with the general decrease in physical activity, there is an increase in organized sports participation among children and adolescents. With this increase, there is an increase in the physical and training demands of each sport. More importantly, this increase in demands occurs at a younger and younger age. In other words, young athletes today are training more intensely and longer hours than in the past. Their performance level is also higher than in the past. An integral component of the higher demands of sport performance today is the inclusion of resistance training. In fact, many young athletes today, whether they are swimming, playing hockey or various ball-game sports, are involved in resistance training. On the other end of the continuum, resistance training has also become a part of the management of chronic childhood conditions, such as obesity, cerebral palsy and even cancer. Some of the important questions to consider when contemplating resistance training for youth include,
- Is resistance training effective in terms of increasing strength during childhood and adolescence?
- Is resistance training safe during childhood and adolescence?
- Does resistance training affect growth during childhood and adolescence?
The answers to these questions are discussed below. However, before embarking on resistance training and its related issues, one must consider the changes that take place in muscle structure and function during growth and maturation. This background will provide a framework for consideration of the impact of resistance training.
Muscle Structure and Function During Growth and Maturation:
Myogenesis occurs predominantly pre-natally. Muscle fibres develop from embryonic mesodermic cells and the number of muscle fibres in each muscle is believed to be achieved by birth, or soon thereafter. During childhood and adolescence, there is no increase in the number of muscle fibres so post-natal increase in muscle mass is a result of muscle fibre hypertrophy, rather than hyperplasia (Lexell et al., 1992). This means that sarcomeres are added in parallel and in series (Figure 17.8). When sarcomeres are added in parallel, this is achieved first by increased size of myofibrils, then by increased number of myofibrils when these myofibrils split.
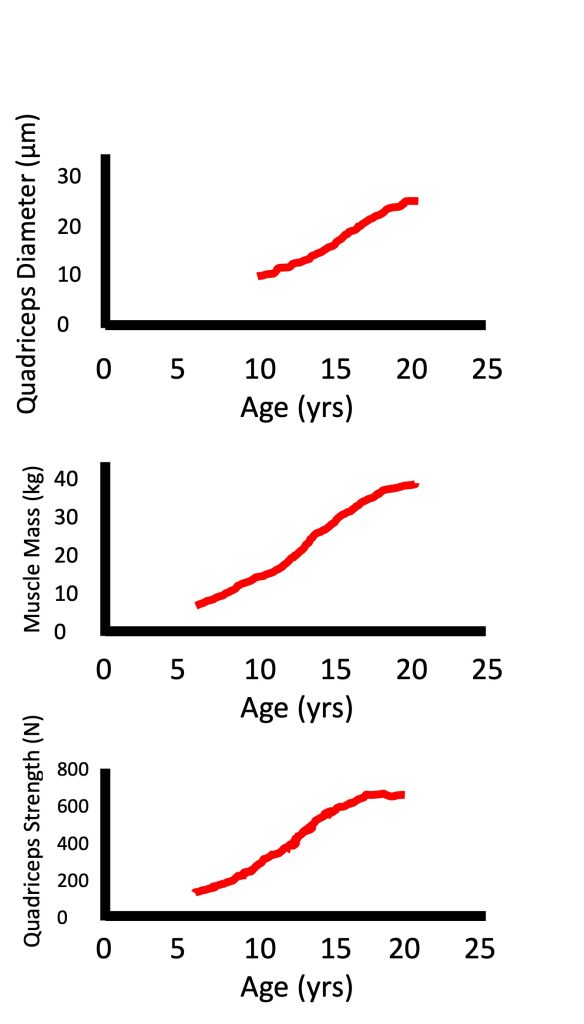
Muscle mass increases linearly during childhood with very small differences between boys and girls. During puberty, the increase in muscle mass is greater in boys compared with girls (Tanner et al., 1981). In fact, the increase in muscle mass during puberty can be about twice as large in boys compared with girls (Johnston and Malina, 1966). At the same time, there is a parallel increase in maximal strength (Figure 17-8). There is a lot of literature on the increase in maximal isometric strength during growth and maturation (see (Blimkie, 1989; Farpour-Lambert and Blimkie, 2008; Sale D.G, 1996)). However, most daily activities, as well as sporting skills, require dynamic, rather than isometric strength. Performance in many activities (e.g., running, jumping, throwing) requires a quick generation of force in a very short time window. Usually, maximal strength is not attained during this short time window. That is, these activities require a high rate of force development, or explosive strength. Surprisingly, we know very little about the changes in dynamic, and especially in explosive strength with growth and development, although we assume that these changes are parallel to the changes in isometric strength.
Factors Explaining Increased Muscle Strength
There are numerous factors that are involved in the increase in strength during growth, above and beyond the increase in body size. Indeed, as seen in Figure 17-8, while muscle diameter and muscle mass can increase about two-fold from age 10 to 15 years, strength increases almost three-fold. When comparing children with adults, their absolute maximal strength is obviously much lower due to their size difference. However, when maximal strength is normalized for body size (for example, using ratio standards with body mass or fat-free mass in the denominator), children are still not as strong as adults (see (Blimkie, 1989; Farpour-Lambert and Blimkie, 2008; Inbar and Bar-Or, 1986; Van Praagh and Dore, 2002) for review). Therefore, factors other than body size must also be considered to explain the strength difference between children and adults. These factors include muscle composition (i.e., fibre type distribution) and neuromuscular activation pattern. Additionally, tendon stiffness may also affect explosive strength. These factors are discussed below.
Type II fibres fibres are known to be larger and able to produce greater force per fibre than type I fibres (see Chapter 5). Therefore, a lower proportion of type II fibres in children may potentially explain the strength difference observed between children and adults. However, the fibre-type distribution is widely considered to be determined by one year of age (Bell et al., 1980; Brooke and Engel, 1969; Dubowitz, 1965; Vogler and Bove, 1985). While few studies suggest that there can be a small increase in the proportion of type II fibres during childhood and adolescence, particularly in males (Jansson, 1996; Lexell et al., 1992), this small increase is insufficient to explain the large age-related differences in static or dynamic strength. Nor are they sufficient to explain the large differences observed in explosive strength between children and adults.
A lower level of neuromuscular activation could also potentially explain children’s lower maximal strength. Several studies have suggested that there is lower motor unit activation in children compared with adults (Grosset et al., 2008; O’Brien et al., 2009; O’Brien et al., 2010). For example, using the interpolated twitch technique, O’Brien and colleagues (O’Brien et al., 2010), recently demonstrated that during maximal voluntary knee extension, adults will activate 85% of their total motor neuron pool, while children activate only 70% of the available motor units. In accordance with the Henneman’s size principle (Henneman et al., 1965)(see Chapter 3), it was recently proposed that the deficit in motor unit activation in children is made up of proportionately larger amount of type-II motor units (Dotan et al., 2012). This suggests that children utilize less of their higher-threshold, type-II motor units compared with adults (see highlight box). This difference could potentially explain not only children’s lower maximal strength, but also their lower explosive strength.
A lower tendon stiffness (higher compliance) is associated with a lower ability to produce force quickly (Wilson et al., 1994). This means that the lower the tendon stiffness, the lower the explosive strength. Therefore, a lower musculo-tendinous stiffness in children may play a partial role in the lower explosive strength typical of children. Indeed, several studies have demonstrated lower musculo-tendinous stiffness in children compared with adults (Grosset et al., 2007; Lambertz et al., 2003). Lambertz and colleagues (Lambertz et al., 2003) found not only a difference between children and adults, but a progressive increase in musculo-tendinous stiffness in children from 7 to 10 years of age. Thus, children’s lower explosive strength, and particularly, the slower of force may be partly explained by the lower musculo-tendinous stiffness, although it cannot account for all the observed age-related differences.
Effects of Resistance Training in Children
One of the myths in resistance training is that it is ineffective in children. In other words, engagement in resistance training among children was not considered to result in enhanced strength. Several early studies supported this view by failing to demonstrate any increase in strength in children who participated in resistance training (Docherty et al., 1987; Vrijens, 1978). However, a closer look at these studies would reveal that either the volume or the intensity of the training program was too low to result in increased strength. Since then, there have been numerous studies which have disputed this myth, demonstrating considerable strength gains in children following resistance training (for reviews see (Behm et al., 2008; Blimkie, 1992; Blimkie, 1993; Falk and Eliakim, 2003; Falk and Tenenbaum, 1996; Malina, 2006)).
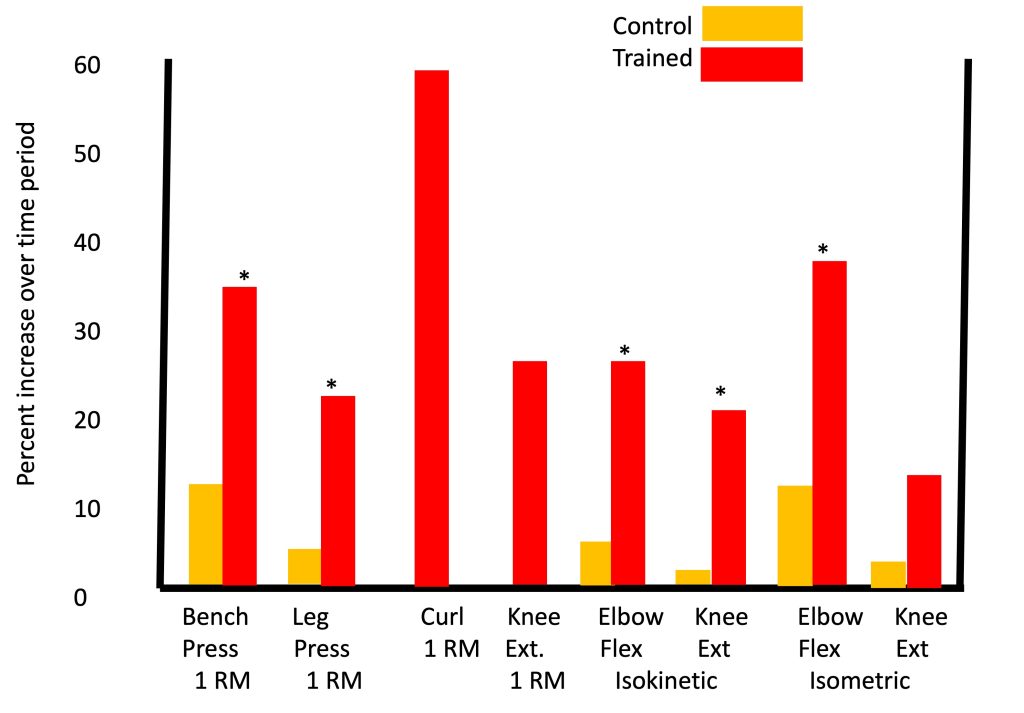
One of the most impressive and comprehensive studies on the effects of resistance training in children was reported by Ramsay and colleagues (Ramsay et al., 1990), in which pre-pubertal boys engaged in resistance training over a period of 20 weeks, which is considered a particularly lengthy training duration for a pediatric research study. Significant strength gains were observed in the training group (with minimal strength gains in the non-training group), whether strength was measured using 1RM tests, isometric or isokinetic testing (Figure 17-9). That is, in each of eight different exercises, boys who trained improved by 15-60%, depending on the type of exercise, significantly more than the boys who did not train.
Today, the effectiveness of resistance training in children is accepted among coaches, as well as among health professionals. Indeed, numerous professional organizations, such as the American College of Sports Medicine, the International Federation of Sports Medicine, the National Strength and Conditioning Association, the British Association of Sport and Exercise Sciences, and many more have published position statements in favour of resistance training for children. The Canadian Society for Exercise Physiology came out with a position statement (Behm et al., 2008) advocating the benefits of several types of resistance training for children.
Accepting that resistance training is indeed effective in enhancing strength in children, the obvious next question is, how effective is it compared to its effectiveness in adults. In order to answer this question, one would have to design a study in which children and adults, preferably at the same baseline level, participated in an identical training program. Technically and logistically, this would be very difficult to do. Indeed, Lillegard and colleagues (Lillegard et al., 1997) examined the effect of resistance training in early and late-pubertal children but did not observe any clear effect of maturity status. Notably, the number of participants in each group was relatively small, making it difficult to observe real differences.
In an effort to examine the relative effects of resistance training on children compared with adults, Sale (Sale, 1989) merged data from two separate studies in which the effect of resistance training on evoked twitch torque (resulting from electrical stimulation) of the elbow flexors and knee extensors was investigated. Although scientifically combining data from two studies is not recommended, in this case the data were collected by the same research group, using the same equipment and testing techniques, and the training programs were similar, so the approach is justified. In both studies, the training group’s strength improved significantly more than the control group, which in view of the above discussion is not surprising. In terms of absolute torque gain at the end of the training period, it is evident that the children improved 50% less than the adults. However, if one compares the relative gain as a percentage of pre-training torque, it is evident that the children improved much more than the adults (about twice as much). Therefore, the answer to whether resistance training is as effective in children as it is in adults is not straight forward. In absolute terms, children improve less. However, relative to their starting level, children may improve more than adults as a result of resistance training.
Mechanisms Explaining the Effects of Resistance Training
Generally, there are two types of mechanisms, which may explain the strength gains observed following resistance training: morphological and neurological adaptations. Both of these mechanisms play a role in children and in adults, but their relative contribution in each age group differs. Morphological adaptations, specifically muscle hypertrophy, are often evident in adults, specifically in men. In children, on the other hand, most studies report no increases in muscle size following resistance training (see (Behm et al., 2008; Falk and Eliakim, 2003; Falk and Tenenbaum, 1996; Sale D.G, 1996; Sale, 1989) for review). Notably, the studies that examined muscle hypertrophy in children have generally used anthropometric techniques (Blimkie, 1989; Granacher et al., 2011; McGovern, 1984; Ozmun et al., 1994; Ramsay et al., 1990; Sailors and Berg, 1987; Siegel et al., 1989). Two studies in which more sensitive methods of measurements were utilized (magnetic resonance imaging and ultrasound) have suggested that muscle hypertrophy, although minimal, may indeed occur among children following resistance training (Mersch and Stoboy, 1989; von Fukunaga et al., 1992). However, even if muscle hypertrophy does occur as a result of resistance training in children, the extent of that hypertrophy is minimal and is likely insufficient to explain the apparent strength gains.
In view of the limited evidence of muscle hypertrophy and its small potential contribution, the main mechanism believed to explain children’s strength gain following resistance training, involves neural adaptation. These adaptations are difficult to define, measure and characterize. Therefore, neurological adaptations in children are mainly based on indirect evidence. There are only three studies that attempted to directly demonstrate neurological changes in children following resistance training. Using the interpolated twitch technique (Chapter 13), Ramsay et al. (Ramsay et al., 1990) demonstrated an increase in motor unit activation of the elbow flexors and knee extensors, following 20 weeks of training. Using the same technique, Waugh et al. (Waugh et al., 2014) could not demonstrate such an increase following 10 weeks of resistance training in young boys, although the number of boys in the study was relatively small. Ozmun et al. (Ozmun et al., 1994) used integrated electromyographic amplitude (IEMG (Chapter 3)) to demonstrate an increase in neuromuscular activation in agonist muscles following eight weeks of training. However, in all cases, the extent of the increased neuromuscular activation of the agonist muscles was much smaller than the increases in strength.
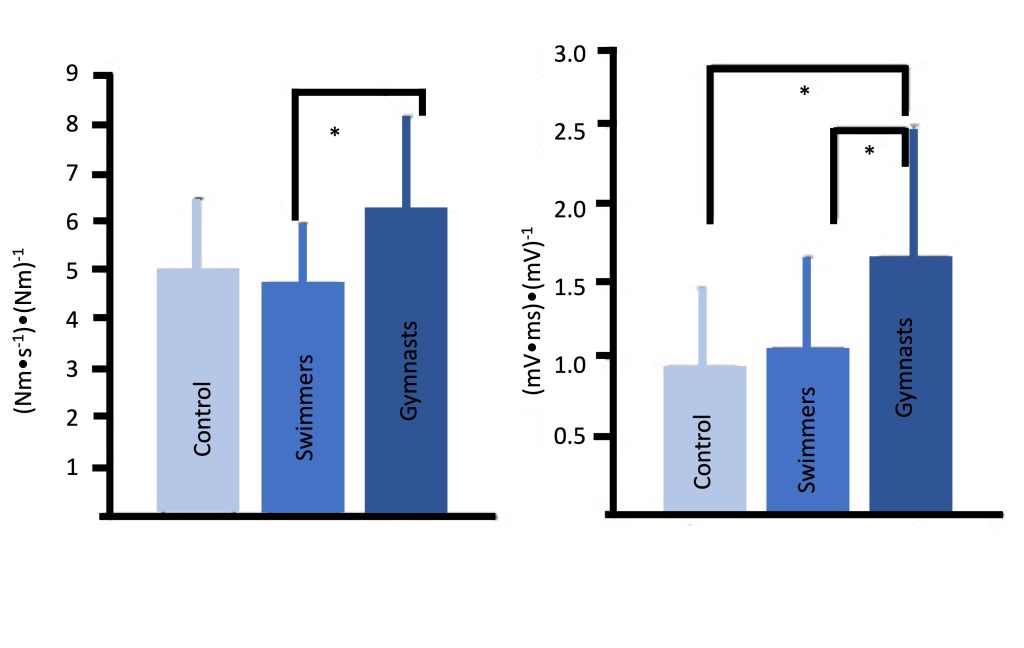
An additional neuromuscular adaptation which may explain some of the strength gains in children may involve improved inter-muscle coordination, which likely plays a more influential role in complex, multi-joint actions. Mitchell and colleagues (Mitchell et al., 2011) observed that young male gymnasts, who presumably engage in extensive resistance training, particularly explosive training, demonstrate much faster rate of muscle activation compared with endurance-trained or untrained boys. Gymnasts were also characterized by a faster rate of force (explosive strength) (Figure 17-10). These findings are supported by a recent study which demonstrated that resistance training (free weights or plyometric training), added to regular soccer training, resulted in enhanced rate of force development, along with increases in the rate of muscle activation (McKinlay et al. 2018).
Safety and Resistance Training
Resistance training has been touted to be unsafe for children and adolescents. Admittedly, all types of physical activity are associated with some risk of injury, including resistance training. The question is whether resistance training is associated with greater risk than other activities. Hamill and colleagues (Hamill, 1994) specifically studied the incidence of injuries among adolescent boys engaged in resistance training, weight lifting and other, more pervasive sports such as rugby and soccer. The authors reported that the incidence of injuries in resistance training and weight lifting was several orders of magnitude lower than the more common sports (0.017-0.035 vs. 0.14 to 8 injuries per 1000 participation-hours). Notably, the authors also reported a higher injury incidence in physical education classes compared with resistance training. More recently, Malina (Malina, 2006) reported similarly low incidence among pre-pubertal boys engaged in resistance training. Thus, it appears that, when properly performed and supervised, resistance training is associated with a lower risk of injury compared with many other prevalent activities. On the other hand, it should be noted that the most serious type of injury, which has been reported to result from resistance training (or weight lifting) is an injury to the epiphyseal (growth) plate. Obviously, this type of injury can appear only in children or adolescents, not adults, and, if left untreated, can have potentially serious consequences. Therefore, in addition to the safety rules, which are recommended for adults, there are several safety precautions, which are particularly important for children. These include adherence to the proper technique, the use of properly-sized equipment, the engagement of properly qualified exercise specialists and a higher instructor-trainee ratio. For a detailed list of recommendations and safety precautions, see the Canadian Society of Exercise Physiologists (CSEP) position statement on resistance training in children and adolescents (Behm et al., 2008).
Thermoregulation During Exercise in the Heat
Thermoregulation is the process by which an organism keeps its body temperature within certain boundaries, even when the surrounding temperature is very different (Chapters 9 & 16). Thermoregulation is affected by environmental factors, such as temperature, humidity and wind, as well as by physiological processes such as metabolic rate (exercise), circulation and sweating. In efficient thermoregulation, heat dissipation (via sweating or skin blood flow) must equal heat production (by the muscles). These processes occur in children, as in adults. This section highlights the differences between children and adults.
The amount of heat dissipated is dependent on the available surface area. On the other hand, the amount of heat produced is dependent on the exercising muscle mass. The smaller the body, the larger the body surface area-to-mass (BSA/M) ratio. Thus, children’s BSA/M ratio can be 30-40% greater than adults’. This geometric difference affects the means of heat dissipation in different environmental conditions (see below).
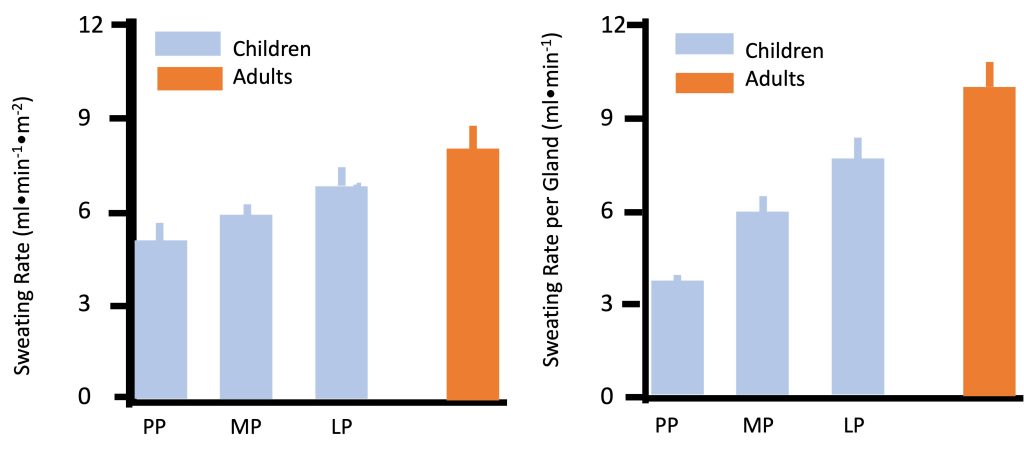
Physiologically, heat can be dissipated via increasing blood flow to the skin (promoting “dry” heat exchange, also known as conduction and convection), or via sweat evaporation (Chapter 9). By far, the most prominent and consistently observed difference between children and adults in regards to temperature regulation is the former’s much lower sweat rate. In any given environmental condition, whether at rest or during exercise, children consistently demonstrate lower sweating rate. For example, during moderate exercise (50% V̇O2max) in dry heat (42C, 20% humidity), sweating rate was lower in pre-pubertal boys compared with men (Figure 17.11a). Sweating rate increases from pre- to late-puberty yet is still lower in late-pubertal boys compared with young men (Falk et al., 1992a; Falk et al., 1992c). Since the number of sweat glands is determined by the age of 2-3 years, the sweating rate per gland is also lower in children (Figure 17.11b). Children’s sweating rate remains lower after taking into account differences in body surface area. Thus, absolute and relative sweating rate is considerably lower in children compared with adults. This age-related difference has been demonstrated consistently in various environmental conditions (see (Falk and Dotan, 2008a; Falk and Dotan, 2008b; Falk and Dotan, 2017) for review). The explanation for the difference in sweating rate may be related to age-related differences in gland size, sensitivity or capacity. But it may also reflect the fact that children may not need to sweat as much.
As mentioned above, heat dissipation is achieved via increasing skin blood flow and via sweating. Children’s blood flow to the skin is greater during exercise in the heat (Drinkwater et al., 1977), and it increases with maturity (Falk et al., 1992b; Falk et al., 1992c). Therefore, it is possible that due to their ability to increase their blood flow to the skin, they do not need to rely on sweat evaporation for effective thermoregulation. In other words, the “strategy” used for thermoregulation is different in children and adults: Children rely more on dry heat loss (via increased skin blood flow), and less on sweat evaporation in order to dissipate the heat produced by the exercising muscles (Falk and Dotan, 2008a; Rowland, 2008).
Does this different thermoregulatory strategy affect the effectiveness of thermoregulation during exercise? In extreme environmental conditions, hot or cold, children may be more vulnerable, but under most conditions, they are at no disadvantage relative to adults. In fact, there are no epidemiological data demonstrating higher rate of heat injury in children, even during heat waves (see (Falk and Dotan, 2008a; Falk and Dotan, 2017; Rowland, 2008) for review).
In view of children’s lower reliance on evaporative heat loss, it may be argued that they may be able to conserve water, relative to adults, during exercise in the heat. However, the issue of proper hydration should not be overlooked. For example, Decher et al. (Decher et al., 2008) demonstrated that among children and adolescents participating in summer sports camps, 50% arrived at their first practice of the day in a hypohydrated state. During exercise, children (as do adults) do not usually consume sufficient fluids and become inadvertently hypohydrated, a phenomenon called “voluntary dehydration”. Wilk et al. (Wilk et al., 2001) demonstrated that about 50% of well-trained acclimated adolescent athletes finished a triathlon at 2-3% hypohydration. More importantly, 7% of the athletes were at a more severe (>3%) state of hypohydration at the end of the competition. The same group of authors also demonstrated that even 1% hypohydration is sufficient to negatively affect performance in 10-12 yr old runners (Wilk et al., 2002).
While the rate of dehydration may be similar in children and adults, the implication of this fluid loss is harsher in children. As demonstrated in Figure 17.12, at a similar state of hypohydration (e.g., 1% body mass), children’s body temperature increases about 50% more than adults’ (e.g., 0.6 vs. 0.4C, respectively). Thus, while children may “conserve” fluids by relying on a lower sweat rate, their need for maintaining proper hydration level is higher. It is unclear whether children’s habitual fluid replacement habits are sufficient during competition, specifically in a hot environment. Therefore, it is up to coaches, teachers and parents to ensure that children rehydrate sufficiently.
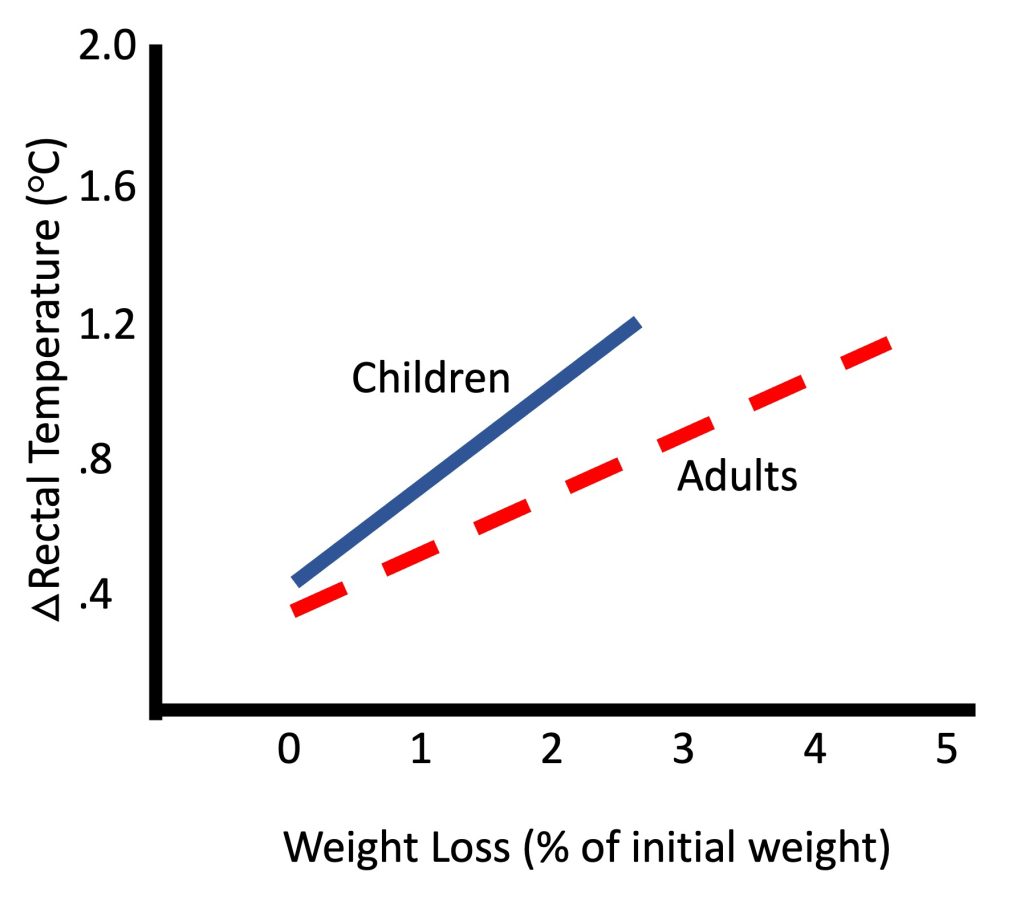
Research Box: Exercise and Bone Development
Osteoporosis is a skeletal disease characterized by low bone mass and deterioration of the micro architecture of bone tissue resulting in bone fragility and susceptibility to fractures. According to the World Health Organization, Osteoporosis is estimated to affect approximately 200 million women worldwide (Kanis, 2007). Although the prevalence of fractures is higher in women, the mortality rate related to fragility fractures is higher in men (Center et al., 1999). A primary risk factor for the of osteoporosis later in life is the inability to attain optimal peak bone mass (PBM) (Heaney et al., 2000). PBM is generally defined as the highest level of bone mass achieved as a result of normal growth and seems to be established for most sites of the skeleton, by early adulthood (Matkovic et al., 1994). In fact, the most rapid bone mineral accumulation occurs approximately one year after the age of peak linear growth (Bailey et al., 1996). It appears, therefore, that there is a critical period, a ‘window of opportunity’, during which we can greatly influence the amount of bone mass we attain (MacKelvie et al., 2002). That is, the pubertal period is the optimal period to ‘put bone in the bank’ and increase PBM.
Bone is the product of complex interactions between genetic and environmental factors including diet, hormonal influences, and mechanical stimuli, usually attained through exercise or physical activity (Gordon, 2003; Steelman and Zeitler, 2001). Importantly, many of these environmental factors undergo changes during the pubertal period.
The use of physical activity (PA) in enhancing PBM, maintaining bone health throughout the lifespan and ultimately preventing osteoporosis has been the focus of considerable research, and Canadian researchers have played a noteworthy role in this field. It is generally accepted that engaging in physical activity during growth enhances bone (Boot et al., 1997; Janz et al., 2001; Janz et al., 2006). The Saskatchewan Pediatric Bone Mineral Accrual Study, which has followed over 200 boys and girls from childhood to adulthood (1991 to present)(Bailey, 1997), has provided convincing evidence demonstrating that during the growing years enhances lean mass, as well as bone accrual and that these benefits are retained at least into early adulthood (Baxter-Jones et al., 2008; Baxter-Jones et al., 2003; Jackowski et al., 2011; Scerpella et al., 2011). Furthermore, ‘when’ activity occurs during the lifespan is important, as at a young age can account for up to 17% of the variance in bone mineral density (BMD) seen in individuals in their late 20s (Davies et al., 2005).
In addition to the timing of PA, the mechanism by which imparts its benefits on bone is also important. Mechanical loading of sufficient intensity to promote increases in skeletal mass during growth requires strains to be greater than those of normal everyday living. If the bone is properly overloaded, the load will elicit a modeling response making the bone susceptible to new levels of mechanical demand (Bailey et al., 1996). Some of the largest loads placed on the skeleton are physiological in nature, resulting from muscle contractions (Rauch et al., 2004; Schoenau and Frost, 2002). Furthermore, gravitational or ground reaction forces are also capable of generating the loads necessary to elicit a favourable response in bone. These two loading methods have led to the investigation of the bone response to different forms of physical activity or training. Athletes involved in high-impact weight-bearing activities (e.g., gymnastics and running) have higher BMD than athletes of non-weight bearing sports (e.g., cycling and swimming), (Duncan et al., 2002), and non-active youth (Lehtonen-Veromaa et al., 2000). In addition, using quantitative ultrasound, another measure reflecting bone strength, soccer players and hockey players have been shown to have higher values in the tibia and radius, respectively. These differences were already apparent in young, pre-pubertal athletes, supporting sport-specific effects on bone strength, independent of body size, as early as the pre-puberty (Falk et al., 2010). Furthermore, training studies involving resistance training and simple jumping exercises have been shown to have positive effects on the developing skeleton through ground reaction forces and muscle contractions (Fuchs and Snow, 2002; Lehtonen-Veromaa et al., 2000; Ludwa and Klentrou, 2006; McKay et al., 2005; Nichols et al., 2001). Based on a recent systematic review (Ludwa and Klentrou, 2011), structured and controlled interventions are also effective in eliciting bone gains in youth. Future research should focus on increasing our understanding of the nature of the interaction between bone accrual and adaptation, and developing optimal interventions to increase PBM, involving and nutrition.
Summary
In summary, this chapter describes the responses and adaptations of children to exercise and training. These responses, for the most part, are similar in pattern to the responses of adults. The magnitude of these responses is, however, different due to the effect of growth and maturation of body structures, and differences in body size. Therefore, physiologically, children are not just small adults. Most of the anatomical and physiological differences observed between children and adults are summarized in Table 17.2.
The chapter first discusses the responses to acute aerobic exercise and to aerobic training. Similar to adults, children’s cardiac output increases during exercise, reflecting the increases in stroke volume and heart rate. These responses allow for the increase in V̇O2 in the exercising muscles. At a given exercise intensity, as well as during maximal exercise intensity, children display higher heart rate, lower absolute stroke volume and lower absolute cardiac output. The lower cardiac output does not necessarily denote cardiac insufficiency. Rather, when adjusted for body size, no appreciable differences in cardiac output are observed between children and adults. In addition, children demonstrate lower blood pressure and size-adjusted total peripheral resistance during aerobic exercise. Their (a-v̅)O2 difference is somewhat higher during submaximal exercise. Therefore, despite their smaller size and different activity habits, children are not disadvantaged in the performance of aerobic activities. In fact, due to their slightly favorable peripheral vascular response, as well as their greater reliance on utilization, they may even have a slight advantage in this type of activities.
Children demonstrate an exaggerated ventilatory response to a given metabolic rate, likely due to differences in airway dimensions or proportions, resulting in inefficient breathing. However, despite their inefficient ventilation, children’s ventilation is greater than adults’, allowing them to benefit from greater gas exchange during exercise.
Boys’ maximal aerobic capacity, relative to body mass, is not different than that of men. Girls’ mass-adjusted maximal aerobic capacity is actually higher than women’s. In addition, in spite of the relatively low training effect on V̇O2max in children, training does result in improved endurance performance. Possible reasons for this improved performance include higher movement economy, improved “tactics” and higher anaerobic ability. In addition, recovery from intense exercise is notably faster in children compared with adults.
Anaerobic performance and strength increase with growth and maturation. In fact, as opposed to maximal aerobic power, scaling for body size does not eliminate the age-related increase in either, maximal or strength. Therefore, factors other than body size must explain the age-related increase in and strength. These factors include possible differences in neuromuscular activation, greater co-contraction of the antagonist muscles in children, as well as lower musculo-tendinous stiffness. While children’s performance in high-intensity exercise is lower than adults’, their recovery is much faster. The faster recovery may be partly due to their lower amount of work output, but is also due to qualitative age-related differences, mainly due to growth and maturation.
Resistance training has been consistently demonstrated to enhance strength in children. However, while adults’ strength enhancement is a result of muscle hypertrophy and neuromuscular adaptations, this is not the case in children. Rather, children’s strength appears to increase solely or mostly as a result of neuromuscular adaptations. The nature of these adaptations has not been fully elucidated. In absolute terms, children’s strength improves less than adults’, but relative to their starting level, children may improve more than adults.
Children are able to tolerate and properly thermoregulate during exercise in the heat. While their sweat rate is much lower than adults’, their blood flow to the skin is higher. Children appear to use a different ‘strategy’ to thermoregulate: they rely more on dissipating heat via dry heat exchange (increasing skin blood flow and losing heat by conduction and convection), and less on sweat evaporation. Therefore, they are able to conserve body water. However, they appear to be more sensitive to a given level of hypohydration, emphasizing the need to encourage fluid consumption during physical activity in a hot environment. This is particularly important for athletes competing in outdoor tournaments.
In conclusion, as demonstrated in Table 17.2, children’s performance and responses to exercise and training differ from those of adults. These age-related differences are quantitative, as well as qualitative, demonstrating that in many ways, children are not small adults and should not be regarded as such.
Table 17-2 Anatomical and Physiological comparison between children and adults.
|
Domain |
Characteristic |
Children compared with Adults |
|
Anatomical |
Muscle mass (as % of body mass) |
Boys: lower Girls: similar or higher |
|
|
Muscle composition |
similar |
|
|
Bone mineral density |
Lower |
|
|
|
|
|
Aerobic exercise |
Maximal oxygen uptake Absolute (l ∙
min-1) |
Lower |
|
|
Maximal oxygen uptake Relative to body mass (ml ∙
kg-1 ∙
min-1) |
Boys: similar Girls: higher (due to lower body percentage) |
|
|
Anaerobic threshold (as % of maximal oxygen uptake) |
Higher |
|
|
Heart rate – rest |
Higher |
|
|
Heart rate – maximal |
Higher |
|
|
Heart rate – given intensity |
Higher |
|
|
Heart rate – similar relative intensity |
Similar or slightly higher |
|
|
Cardiac output absolute |
Lower |
|
|
Cardiac output relative to surface area |
Similar |
|
|
|
|
|
|
(a- v̅
)O2 difference exercise |
Higher |
|
|
Blood pressure – rest |
Lower |
|
|
Blood pressure – exercise |
Lower |
|
|
Muscle blood flow – exercise |
Higher |
|
|
Total peripheral resistance absolute |
Higher |
|
|
Total peripheral resistance relative to muscle mass |
Lower |
|
|
Pulmonary ventilation absolute |
Lower |
|
|
Pulmonary ventilation relative to oxygen consumption |
Higher |
|
|
Cost of breathing |
Higher (lower breathing efficiency) |
|
|
Alveolar ventilation |
Higher |
|
|
V̇
O2 kinetics (onset and offset of exercise) |
Faster |
|
|
Fuel utilization |
Greater relative reliance on fats |
|
|
Trainability |
Lower |
|
|
|
|
|
Anaerobic capacity Absolute and relative to body mass |
Lower |
|
|
|
Blood lactate levels |
Lower |
|
|
Anaerobic enzymatic activity |
Lower |
|
|
|
|
|
|
Recovery from exercise |
Faster |
|
|
Trainability |
Similar (very little data available) |
|
|
|
|
|
Muscle strength |
Maximal strength Absolute and relative to body size |
Lower |
|
|
Explosive strength Absolute and relative to body size |
Lower |
|
|
Neuromuscular activation |
Lower (see Highlight box) |
|
|
Musculo-tendinous stiffness |
Lower |
|
|
Trainability |
Similar |
|
|
|
|
|
Thermoregulation |
Thermoregulation effectiveness |
Similar |
|
|
Sweating rate |
Lower |
|
|
Skin blood flow |
Higher |
|
|
Inadvertent dehydration |
Similar |
|
|
Sensitivity to hypohydration |
Higher |
|
|
|
|
Exercises or Topics for Discussion
What are the cardiovascular factors that may change as a result of aerobic training and may explain the typical improvement in V̇O2max seen after training? Are the effects of aerobic training on each of these factors similar in children and in adults? Explain.
You have volunteered to help coach your school’s soccer team (grades 4-6 boys and girls). The teacher who has been coaching soccer for the last few years is happy to have you aboard, as she knows you have recently become a kinesiologist. She therefore asks your advise on whether to devote any practice time to develop aerobic ability in the children (they are not particularly well-trained). She asks whether you expect any benefits of aerobic training in these children. What is your advise?
Considering osteoporosis is characteristic of old(er) age, explain why we should be concerned with bone health during childhood. What can we do in order to reduce the risk of osteoporotic fractures in old(er) age?
In your opinion, does athletic training affect (enhance/delay) growth? Justify.
References
Anderson CS, and Mahon AD. 2007. The relationship between ventilatory and lactate thresholds in boys and men. Research in Sports Medicine 15(3):189-200.
Armatas V, Bassa E, Patikas D, Kitsas I, Zangelidis G, and Kotzamanidis C. 2010. Neuromuscular differences between men and prepubescent boys during a peak isometric knee extension intermittent test. Pediatric Exercise Science 22(2):205-217.
Armstrong N, and Barker AR. 2009. Oxygen uptake kinetics in children and adolescents: a review. Pediatric Exercise Science 21(2):130-147.
Armstrong N, Welsman JR, and Chia MY. 2001. Short term output in relation to growth and maturation. British Journal of Sports Medicine 35(2):118-124.
Asai H, and Aoki J. 1996. Force of dynamic and static contractions in children and adults. International Journal of Sports Medicine 17(3):170-174.
Asmussen E, and Heeboll-Nielsen K. 1955. A dimensional analysis of physical performance and growth in boys. Journal of Applied Physiology 7(6):593-603.
Asmussen E, and Heeboll-Nielsen K. 1956. Physical performance and growth in children; influence of sex, age and intelligence. Journal of Applied Physiology 8(4):371-380.
Bailey DA. 1997. The Saskatchewan Pediatric Bone Mineral Accrual Study: bone mineral acquisition during the growing years. International Journal of Sports Medicine 18 Suppl 3:S191-194.
Bailey DA, Faulkner RA, and McKay HA. 1996. Growth, physical activity and bone mineral acquisition. In: Holloszy JO, editor. Exercise and Sports Science Reviews. Baltimore: Williams & Wilkins. p 233-266.
Bar-Or O, and Rowland T. 2004. Pediatric Exercise Medicine. Champaign, IL: Human Kinetics.
Bassett DR Jr., and Howley ET. 2000. Limiting factors for maximum and determinants of endurance performance. Medicine & Science in Sports and Exercise 32(1):70-84.
Baxter-Jones AD, Eisenmann JC, Mirwald RL, Faulkner RA, and Bailey DA. 2008. The influence of physical activity on lean mass accrual during adolescence: a longitudinal analysis. Journal of Applied Physiology 105(2):734-741.
Baxter-Jones AD, Mirwald RL, McKay HA, and Bailey DA. 2003. A longitudinal analysis of sex differences in bone mineral accrual in healthy 8-19-year-old boys and girls. Annals of Human Biology 30(2):160-175.
Baxter-Jones ADG, and Helms PJ. 1996. Effects of training at a young age: A review of the training of young athletes (TOYA) study. Pedeatric Exercise Science 8:310-327.
Behm DG, Faigenbaum AD, Falk B, and Klentrou P. 2008. Canadian Society for Exercise Physiology position paper: resistance training in children and adolescents. Applied Physiology, Nutrition, and Metabolism 33(3):547-561.
Belanger AY, and McComas AJ. 1989. Contractile properties of human skeletal muscle in childhood and adolescence. European Journal of Applied Physiology and Occupational Physiology 58(6):563-567.
Bell RD, MacDougall JD, Billeter R, and Howald H. 1980. Muscle fiber types and morphometric analysis of skeletal msucle in six-year-old children. Medicine & Science in Sports & Exercise 12(1):28-31.
Blimkie CJ. 1989. Age- and sex-associated variation in strength during childhood: Anthropometric, morphologic, neurologic, biomechanical, endocrinologic, genetic, and physical activity correlates. In: Gisolfi CV, editor. Perspectives in Exercise Science and Sports Medicine, Vol. 2: Youth, Exercise and Sports. Indianapolis, IN: Benchmark Press. p 99-163.
Blimkie CJ. 1992. Resistance training during pre- and early puberty: efficacy, trainability, mechanisms, and persistence. Canadian Journal of Sport Sciences 17(4):264-279.
Blimkie CJ. 1993. Resistance training during preadolescence. Issues and controversies. Sports Medicine 15(6):389-407.
Boot AM, de Ridder MA, Pols HA, Krenning EP, and de Muinck Keizer-Schrama SM. 1997. Bone mineral density in children and adolescents: relation to puberty, calcium intake, and physical activity. The Journal of Clinical Endocrinology Metabolism 82(1):57-62.
Bouchard C. 1995. Individual differences in the response to regular exercise. International Journal of Obesity and Related Metabolic Disorders 19 Suppl 4:S5-8.
Brooke MH, and Engel WK. 1969. The histographic analysis of human muscle biopsies with regard to fiber types. 4. Children’s biopsies. Neurology 19(6):591-605.
Buckler JMH, and Brodie DA. 1977. Growth and maturity characteristics of schoolboy gymnasts. Annals of Human Biology 4:455-463.
Cacciari E, Mazzanti L, Tassinari D, Bergamaschi R, Magnani C, Zappulla F, Nanni G, Cobianchi C, Ghini T, Pini R, and Tani G. 1990. Effects of sport (football) on growth: auxological, anthropometric and hormonal aspects. European Journal of Applied Physiology and Occupational Physiology 61(1-2):149-158.
Carli G, Martelli G, Viti A, Baldi L, Bonifazi M, Lupo di Prisco C. 1983. Modulation of hormone levels in male swimmers during training. In: Hollander A, Huijing P, and de Groot D, editors. Biomechanics in Medicine and Swimming. Champaign IL: Human Kinetics. p 33-40.
Caufriez A. 1991. Menstrual disorders in adolescence: pathophysiology and treatment. Hormone Research 36(3-4):156-159.
Center JR, Nguyen TV, Schneider D, Sambrook PN, and Eisman JA. 1999. Mortality after all major types of osteoporotic fracture in men and women: an observational study. The Lancet 353(9156):878-882.
Cohen R, Mitchell C, Dotan R, Gabriel D, Klentrou P, Falk B. 2010. Do neuromuscular adaptations occur in endurance-trained boys and men? Applied Physiology, Nutrition, and Metabolism 35(4):471-479.
Daniels SR, Kimball TR, Morrison JA, Khoury P, Witt S, and Meyer RA. 1995. Effect of lean body mass, mass, blood pressure, and sexual maturation on left ventricular mass in children and adolescents. Statistical, biological, and clinical significance. Circulation 92(11):3249-3254.
Davies JH, Evans BA, and Gregory JW. 2005. Bone mass acquisition in healthy children. Archives of Disease in Childhood 90(4):373-378.
de Simone G, Devereux RB, Kimball TR, Mureddu GF, Roman MJ, Contaldo F, and Daniels SR. 1998. Interaction between body size and cardiac workload: influence on left ventricular mass during body growth and adulthood. Hypertension 31(5):1077-1082.
Decher NR, Casa DJ, Yeargin SW, Ganio MS, Levreault ML, Dann CL, James CT, McCaffrey MA, Oconnor CB, and Brown SW. 2008. Hydration status, knowledge, and behavior in youths at summer sports camps. International Journal of Sports Physiology and Performance 3(3):262-278.
Dekkers C, Treiber FA, Kapuku G, Van Den Oord EJ, and Snieder H. 2002. Growth of left ventricular mass in African American and European American youth. Hypertension 39(5):943-951.
Docherty D, Wenger HA, Collis ML, and Quinney HA. 1987. The effects of variable speed resistance training on strength in prepubertal boys. Journal of Human Movement Studies 13:377-382.
Dotan R, Mitchell C, Cohen R, Gabriel D, Klentrou P, and Falk B. 2013. Child-adult differences in the kinetics of torque development. Journal of Sports Sciences 31(9):945-953.
Dotan R, Mitchell C, Cohen R, Klentrou P, Gabriel D, and Falk B. 2012. Child-adult differences in muscle activation – a review. Pediatric Exercise Science 24(1):2-21.
Dotan R, Ohana S, Bediz C, and Falk B. 2003. Blood lactate disappearance dynamics in boys and men following exercise of similar and dissimilar peak-lactate concentrations. Journal of Pediatric Endocrinology and Metabolism 16(3):419-429.
Drinkwater BL, Kupprat IC, Denton JE, Crist JL, and Horvath SM. 1977. Response of prepubertal girls and college women to work in the heat. Journal of Applied Physiology 43(6):1046-1053.
Dubowitz V. 1965. Enzyme histochemistry of skeletal muscle. Journal of Neurology, Neurosurgery, and Psychiatry 28(6):516-524.
Duncan CS, Blimkie CJ, Cowell CT, Burke ST, Briody JN, and Howman-Giles R. 2002. Bone mineral density in adolescent female athletes: relationship to exercise type and strength. Medicine & Science in Sports & Exercise 34(2):286-294.
Eriksson B.O. 1980. Muscle metabolism in children–a review. Acta Paediatrica Scandinavica Supplement 283:20-28.
Eriksson BO, Gollnick PD, and Saltin B. 1973. Muscle metabolism and enzyme activities after training in boys 11-13 years old. Acta Physiologica Scandinavica 87(4):485-497.
Eriksson BO, Karlsson J, and Saltin B. 1971. Muscle metabolites during exercise in pubertal boys. Acta Paediatrica Scandinavica Supplement 217:154-157.
Eriksson BO, and Koch G. 1973. Effect of physical training on hemodynamic response during submaximal and maximal exercise in 11-13-year old boys. Acta Physiologica Scandinavica 87(1):27-39.
Falk B, and Bar-Or O. 1993. Longitudinal changes in peak aerobic and anaerobic mechanical of circumpubertal boys. Pediatric Exercise Science 5:318-331.
Falk B, Bar-Or O, Calvert R, and MacDougall JD. 1992a. Sweat gland response to exercise in the heat among pre-, mid-, and late-pubertal boys. Medicine & Science in Sports & Exercise 24(3):313-319.
Falk B, Bar-Or O, MacDougall D, Goldsmith C, and McGillis L. 1992b. A longitudinal analysis of the sweating response of pre-, mid- and late-pubertal boys during exercise in the heat. American Journal of Human Biology 4(527-535).
Falk B, Bar-Or O, and MacDougall JD. 1992c. Thermoregulatory responses of pre-, mid-, and late-pubertal boys to exercise in dry heat. Medicine & Science in Sports & Exercise 24(6):688-694.
Falk B, Braid S, Moore M, Yao M, Sullivan P, Klentrou N. 2010. Bone properties in child and adolescent male hockey and soccer players. Journal of Science and Medicine in Sport 13(4):387-91.
Falk B, and Dotan R. 2006. Child-adult differences in the recovery from high-intensity exercise. Exercise and Sport Sciences Reviews 34(3):107-112.
Falk B, and Dotan R. 2008a. Children’s thermoregulation during exercise in the heat – a revisit. Applied Physiology, Nutrition, and Metabolism 33(2):420-427.
Falk B, and Dotan R. 2008b. Temperature regulation in children. In: Armstrong N, and Van Mechelen W, editors. Paediatric Exercise Science and Medicine. New York: Oxford University Press. p 309-324.
Falk B, and Dotan R. 2017. Temperature Regulation. In: Armstrong N, and Van Mechelen W, editors. Oxford Textbook of Children’s Sport and Exercise Medicine. 3rd ed. Oxford, UK: Oxford University Press. p 195-222.
Falk B, and Eliakim A. 2003. Resistance training, skeletal muscle and growth. Pediatric Endocrinology Reviews 1(2):120-127.
Falk B, and Tenenbaum G. 1996. The effectiveness of resistance training in children. A meta-analysis. Sports Medicine 22(3):176-186.
Farpour-Lambert NJ, and Blimkie CJ. 2008. Muscle strength. In: Armstrong N, and Van Mechelen W, editors. Pediatric Exercise Science and Medicine. Oxford: Oxford University Press. p 37-52.
Fawkner SG, and Armstrong N. 2004. Longitudinal changes in the kinetic response to heavy-intensity exercise in children. Journal of Applied Physiology 97(2):460-466.
Frisch RE, and McArthur JW. 1974. Menstrual cycles: Fatness as a determinant of minimun weight for height necessary for their maintenance or onset. Science 185:949-951.
Frost G, Bar-Or O, Dowling , and Dyson K. 2002. Explaining differences in the metabolic cost and efficiency of treadmill locomotion in children. Journal of Sports Sciences 20(6):451-461.
Fuchs RK, and Snow CM. 2002. Gains in hip bone mass from high-impact training are maintained: a randomized controlled trial in children. The Journal of Pediatrics 141(3):357-362.
Georgopoulos NA, Theodoropoulou A, Roupas NA, Rottstein L, Tsekouras A, Mylonas P, Vagenakis GA, Koukkou E, Armeni AK, Sakellaropoulos G, Leglise M, Vagenakis AG, and Markou KB. 2012. Growth velocity and final height in elite female rhythmic and artistic gymnasts. Hormones (Athens) 11(1):61-69.
Gordon CM. 2003. Normal bone accretion and effects of nutritional disorders in childhood. Journal of Womens Health (Larchmt) 12(2):137-143.
Granacher U, Goesele A, Roggo K, Wischer T, Fischer S, Zuerny C, Gollhofer A, and Kriemler S. 2011. Effects and mechanisms of strength training in children. International Journal of Sports Medicine 32(5):357-364.
Gratas-Delamarche A, Mercier J, Ramonatxo M, Dassonville J, and Prefaut C. 1993. Ventilatory response of prepubertal boys and adults to carbon dioxide at rest and during exercise. European Journal of Applied Physiology and Occupational Physiology 66(1):25-30.
Grosset JF, Mora I, Lambertz D, and Perot C. 2007. Changes in stretch reflexes and muscle stiffness with age in prepubescent children. Journal of Applied Physiology 102(6):2352-2360.
Grosset JF, Mora I, Lambertz D, and Perot C. 2008. Voluntary activation of the triceps surae in prepubertal children. Journal of Electromyography and Kinesiology 18(3):455-465.
Gurd B, and Klentrou P. 2003. Physical and pubertal in young male gymnasts. Journal of Applied Physiology 95(3):1011-1015.
Hale CJ. 1956. Physiologic maturity of little league baseball players. Research Quarterly 27:276-284.
Halin R, Germain P, Bercier S, Kapitaniak B, and Buttelli O. 2003. Neuromuscular response of young boys versus men during sustained maximal contraction. Medicine & Science in Sports & Exercise 35(6):1042-1048.
Hamill B. 1994. Relative safety of weight lifting and weight training. Journal of Strength and Conditioning Research 8:53-57.
Hamm T. 1991. Physiology of normal female bleeding. NAACOGS Clinical Issues in Perinatal and Womens Health Nursing 2(3):289-293.
Heaney RP, Abrams S, Dawson-Hughes B, Looker A, Marcus R, Matkovic V, and Weaver C. 2000. Peak bone mass. Osteoporos International 11(12):985-1009.
Hebestreit H, Meyer F, Htay H, Heigenhauser GJ, and Bar-Or O. 1996. Plasma metabolites, volume and electrolytes following 30-s high-intensity exercise in boys and men. European Journal of Applied Physiology and Occupational Physiology 72(5-6):563-569.
Henneman E, Somjen G, and Carpenter DO. 1965. Functional Significance of Cell Size in Spinal Motoneurons. Journal of Neurophysiology 28:560-580.
Inbar O, and Bar-Or O. 1986. Anaerobic characteristics in male children and adolescents. Medicine & Science in Sports & Exercise 18(3):264-269.
Jackowski SA, Erlandson MC, Mirwald RL, Faulkner RA, Bailey DA, Kontulainen SA, Cooper DM, and Baxter-Jones AD. 2011. Effect of maturational timing on bone mineral content accrual from childhood to adulthood: evidence from 15 years of longitudinal data. Bone 48(5):1178-1185.
Jansson E. 1996. Age-related fiber type changes in human skeletal muscle. In: Maughan RJ, and Shirreffs SM, editors. Biochemistry of Exercise IX. Champaign, IL: Human Kinetics. p 297-307.
Janz KF, Burns TL, Torner JC, Levy SM, Paulos R, Willing MC, and Warren JJ. 2001. Physical activity and bone measures in young children: the Iowa bone study. Pediatrics 107(6):1387-1393.
Janz KF, Gilmore JM, Burns TL, Levy SM, Torner JC, Willing MC, and Marshall TA. 2006. Physical activity augments bone mineral accrual in young children: The Iowa Bone Development study. The Journal of Pediatrics 148(6):793-799.
Johnston FE, and Malina RM. 1966. Age changes in the composition of the upper arm in Philadelphia children. Human Biology 38(1):1-21.
Kaczor JJ, Ziolkowski W, Popinigis J, and Tarnopolsky MA. 2005. Anaerobic and aerobic enzyme activities in human skeletal muscle from children and adults. Pediatric Research 57(3):331-335.
Kanis J.A.o.b.o.t.W.H.O.S.G. 2007. Assessment of osteoporosis at the primary health-care level. World Health Organization Collaborating Centre for Metabolic Bone Diseases.
Kaprio J, Rimpela A, Winter T, Viken RJ, Rimpela M, Rose RJ. 1995. Common genetic influences on BMI and age at menarche. Humman Biology, 67:739-753.
Klentrou N. 2006. Puberty and Athletic Sports in Female Adolescents. Annales Nestle [Fr] 64(2):85-94.
Klentrou N, Nishio M.-L, and Plyley M. 2006. Ventilatory breakpoints in boys and men. Pediatric Exercise Science 18(2):216-225.
Koch G. 1980. Aerobic power, lung dimensions, ventilatory capacity and muscle blood flow in 12-16 year-old boys with high physical activity. In: Berg K, and Eriksson BO, editors. Children and Exercise. Baltimore, MD: University Park Press. p 99-108.
Lambertz D, Mora I, Grosset JF, and Perot C. 2003. Evaluation of musculotendinous stiffness in prepubertal children and adults, taking into account muscle activity. Journal of Applied Physiology 95(1):64-72.
Leclair E, Berthoin S, Borel B, Thevenet D, Carter H, Baquet G, and Mucci P. 2012. Faster pulmonary kinetics in children vs adults due to enhancements in oxygen delivery and extraction. Scandinavian Journal of Medicine & Science in Sports 23(6):705-12.
Lehtonen-Veromaa M, Mottonen T, Svedstrom E, Hakola P, Heinonen OJ, and Viikari J. 2000. Physical activity and bone mineral acquisition in peripubertal girls. Scandinavian Journal of Medicine & Science in Sports 10(4):236-243.
Lexell J, Sjostrom M, Nordlund AS, and Taylor CC. 1992. Growth and of human muscle: a quantitative morphological study of whole vastus lateralis from childhood to adult age. Muscle & Nerve 15(3):404-409.
Lillegard WA, Brown EW, Wilson DJ, Henderson R, and Lewis E. 1997. Efficacy of strength training in prepubescent to early postpubescent males and females: effects of gender and maturity. Pediatric Rehabilitation 1(3):147-157.
Lloyd RS, Faigenbaum AD, Stone MH, Oliver JL, Jeffreys I, Moody JA, Brewer C, Pierce KC, McCambridge TM, Howard R, Herringtion L, Hainline B, Micheli LJ, Jaques R, Kraemer WJ, McBride MG, Best TN, Chu DA, Alvar BA, and Myer GD. 2014. Position statement on youth resistance training: the 2014 International Consensus. British Journal of Sports Medicine 48(7):498-505.
Long D, Dotan R, Pitt B, McKinlay B, O’Brien TD, Tokuno C, and Falk B. 2017. The Electromyographic Threshold in Girls and Women. Pediatric Exercise Science 29(1):84-93.
Loucks AB. 1995. The reproductive system and physical activity in adolescents. In: Blimkie CJR, and Bar-Or O, editors. New Horizons in Pediatric Exercise Science. Champaign, IL.: Human Kinetics. p 27-37.
Ludwa I, and Klentrou N. 2006. Physical activity interactions with bone accrual in children and adolescents. In: Dionyssiotis Y, editor. Osteoporosis: InTech Open Access Publishers. p 379-408.
Ludwa I, and Klentrou N. 2011. Physical activity interactions with bone accrual in children and adolescents. In: Dionyssiotis Y, editor. Osteoporosis: InTech Open Access Publishers. p 379-408.
Macek M, and Vavra J. 1985. Anaerobic threshold in children. In: Binkhorst RA, Kemper HCG, and Saris WHM, editors. Children and Exercise. Champaign, IL: Human Kinetics. p 110-113.
MacKelvie KJ, Khan KM, and McKay HA. 2002. Is there a critical period for bone response to weight-bearing exercise in children and adolescents? a systematic review. British Journal of Sports Medicine 36(4):250-257; discussion 257.
Malina RM. 1983. Biological maturity status of young athletes. In: Brown EW, and Branta CF, editors. Competitive Sports for Children and Youth. Champaign, IL.: Human Kinetics. p 121-140.
Malina RM. 2006. Weight training in youth-growth, maturation, and safety: an evidence-based review. Clinical Journal of Sports Medicine 16(6):478-487.
Malina RM., Bouchard C., and Bar-Or O. 2004. Growth, Maturation and Physical Activity. Champaign, IL: Human Kinetics.
Malina RM., Pena Reyes M.E., Eisenmann J.C., Horta L., Rodrigues J., Miller R. 2000. Height, mass and skeletal maturity of elite Portuguese soccer players aged 11-16 years. Journal of Sports Sciences 18(9):685-693.
Mansfield MJ, and Emans SJ. 1993. Growth in female gymnasts: should training decrease during puberty? Journal of Pediatrics 122:237-240.
Martin RJ, Dore E, Twisk J, van Praagh E, Hautier CA, and Bedu M. 2004. Longitudinal changes of maximal short-term peak in girls and boys during growth. Medicine & Science in Sports & Exercise 36(3):498-503.
Martinez LR, and Haymes EM. 1992. Substrate utilization during treadmill running in prepubertal girls and women. Medicine & Science in Sports & Exercise 24(9):975-983.
Matkovic V, Jelic T, Wardlaw GM, Ilich JZ, Goel PK, Wright JK, Andon MB, Smith KT, and Heaney RP. 1994. Timing of peak bone mass in Caucasian females and its implication for the prevention of osteoporosis. Inference from a cross-sectional model. The Journal of Clinical Investigation 93(2):799-808.
McGovern M. 1984. Effects of circuit weight training on the physical fitness of prepubescent children. Dissertation Abstracts International 45:452A-453A.
McKay HA, MacLean L, Petit M, MacKelvie-O’Brien K, Janssen P, Beck T, and Khan KM. 2005. “Bounce at the Bell”: a novel program of short bouts of exercise improves proximal femur bone mass in early pubertal children. British Journal of Sports Medicine 39(8):521-526.
McKinlay BJ, Wallace P, Dotan R, Long D, Tokuno C, Gabriel DA, and Falk B. 2018. Effects of Plyometric and Resistance Training on Muscle Strength, Explosiveness, and Neuromuscular Function in Young Adolescent Soccer Players. Journal of Strength and Conditioning Research 32(11):3039-3050.
Mercier J, Varray A, Ramonatxo M, Mercier B, and Prefaut C. 1991. Influence of anthropometric characteristics on changes in maximal exercise ventilation and breathing pattern during growth in boys. European Journal of Applied Physiology and Occupational Physiology 63(3-4):235-241.
Mersch F, and Stoboy H. 1989. Strength training and muscle hypertrophy in children. In: Oseeid S, and Carlson KH, editors. International Series on Sports Sciences. Children and Exercise XIII. Champaign, IL: Human Kinetics. p 165-192.
Mitchell C, Cohen R, Dotan R, Gabriel D, Klentrou P, Falk B. 2011. Rate of muscle activation in power- and endurance-trained boys. International Journal of Sports Physiology and Performance 6(1):94-105.
Moore SA, Moore M, Klentrou P, Sullivan P, and Falk B. 2010. Maturity status in male child and adolescent athletes. Journal of Sports Medicine and Physical Fitness 50(4):486-493.
Nevill AM. 1997. The appropriate use of scaling techniques in exercise physiology. Pediatric Exercise Science 9:295-298.
Nichols DL, Sanborn CF, and Love AM. 2001. Resistance training and bone mineral density in adolescent females. The Joural of Pediatrics 139(4):494-500.
Nottin S, Vinet A, Stecken F, N’Guyen LD, Ounissi F, Lecoq AM, and Obert P. 2002a. Central and peripheral cardiovascular adaptations to exercise in endurance-trained children. Acta Physiologica Scandinavica 175(2):85-92.
Nottin S, Vinet A, Stecken F, Nguyen LD, Ounissi F, Lecoq AM, and Obert P. 2002b. Central and peripheral cardiovascular adaptations during a maximal cycle exercise in boys and men. Medicine & Science in Sports & Exercise 34(3):456-463.
O’Brien TD, Reeves ND, Baltzopoulos V, Jones DA, and Maganaris CN. 2009. The effects of agonist and antagonist muscle activation on the knee extension moment-angle relationship in adults and children. European Journal of Applied Physiology 106(6):849-856.
O’Brien TD, Reeves ND, Baltzopoulos V, Jones DA, and Maganaris CN. 2010. In vivo measurements of muscle specific tension in adults and children. Experimental Physiology 95(1):202-210.
Obert P, Mandigouts S, Nottin S, Vinet A, N’Guyen LD, and Lecoq AM. 2003. Cardiovascular responses to endurance training in children: effect of gender. European Journal of Clinical Investigation 33(3):199-208.
Obert P, Stecken F, Courteix D, Lecoq AM, and Guenon P. 1998. Effect of long-term intensive endurance training on left ventricular structure and diastolic function in prepubertal children. International Journal of Sports Medicine 19(2):149-154.
Ozmun JC, Mikesky AE, and Surburg PR. 1994. Neuromuscular adaptations following prepubescent strength training. Medicine & Science in Sports & Exercise 26(4):510-514.
Paradis G, Lambert M, O’Loughlin J, Lavallee C, Aubin J, Delvin E, Levy E, and Hanley JA. 2004. Blood pressure and adiposity in children and adolescents. Circulation 110(13):1832-1838.
Peltenburg AL, Erich WB, Bernink MJ, Zonderland ML, and Huisveld IA. 1984. Biological maturation, body composition, and growth of female gymnasts and control groups of schoolgirls and girl swimmers, aged 8 to 14 years: a cross-sectional survey of 1064 girls. International Journal of Sports Medicine 5(1):36-42.
Pfeiffer KA, Lobelo F, Ward D, and Pate R. 2008. Endurance trainability of children and youth. In: Heberstreit H, and Bar-Or O, editors. The Young Athlete. Oxford: Blackwell Publishing Ltd. p 84-95.
Pichler G, Urlesberger B, Jirak P, Zotter H, Reiterer E, Muller W, and Borkenstein M. 2004. Reduced forearm blood flow in children and adolescents with type 1 diabetes (measured by near-infrared spectroscopy). Diabetes Care 27(8):1942-1946.
Pitt B, Dotan R, Millar J, Long D, Tokuno C, O’Brien T, and Falk B. 2015. The electromyographic threshold in boys and men. European Journal of Applied Physiology 115(6):1273-1281.
Ramsay JA, Blimkie CJ, Smith K, Garner S, MacDougall JD, and Sale DG. 1990. Strength training effects in prepubescent boys. Medicine & Science in Sports & Exercise 22(5):605-614.
Ratel S, Bedu M, Hennegrave A, Dore E, and Duche P. 2002. Effects of age and recovery duration on peak output during repeated cycling sprints. International Journal of Sports Medicine 23(6):397-402.
Ratel S, Tonson A, Le Fur Y, Cozzone P, and Bendahan D. 2008. Comparative analysis of skeletal muscle oxidative capacity in children and adults: a 31P-MRS study. Applied Physiology, Nutrition, and Metabolism 33(4):720-727.
Ratel S, Williams CA, Oliver J, and Armstrong N. 2004. Effects of age and of exercise on output profiles during repeated sprints. European Journal of Applied Physiology 92(1-2):204-210.
Rauch F, Bailey DA, Baxter-Jones A, Mirwald R, and Faulkner R. 2004. The ‘muscle-bone unit’ during the pubertal growth spurt. Bone 34(5):771-775.
Riddell MC, Jamnik V.K, Iscoe K.E, Timmons B.W, and Gledhill N. 2008. Fat oxidation rate and the exercise intensity that elicits maximal oxidation decreases with pubertal status in young male subjects. Journal of Applied Physiology 105(2):742-748.
Rilling JK, Worthman CM, Campbell BC, Stallings JF, and Mbizva M. 1996. Ratios of plasma and salivary testosterone throughout puberty: production versus bioavailability. Steroids 61(6):374-378.
Rotstein A, Dotan R, Bar-Or O, and Tenenbaum G. 1986. Effect of training on , maximal aerobic and anaerobic performance of preadolescent boys. International Journal of Sports Medicine 7(5):281-286.
Rowland T. 2005. Children’s exercise physiology. Champaign, IL: Human Kinetics.
Rowland T. 2008. Thermoregulation during exercise in the heat in children: old concepts revisited. Journal of Applied Physiology 105(2):718-724.
Rowland T, Goff D, Popowski B, DeLuca P, and Ferrone L. 1998. Cardiac responses to exercise in child distance runners. International Journal of Sports Medicine 19(6):385-390.
Rowland T, Pober D, and Garrison A. 2008. Cardiovascular drift in euhydrated prepubertal boys. Applied Physiology, Nutrition, and Metabolism 33(4):690-695.
Rowland T, and Whatley Blum J. 2000. Cardiac dynamics during upright cycle exercise in boys. American Journal of Human Biology 12(6):749-757.
Rowland TW, and Cunningham LN. 1997. Development of ventilatory responses to exercise in normal white children. A longitudinal study. Chest 111(2):327-332.
Rowland TW, and Green GM. 1988. Physiological responses to treadmill exercise in females: adult-child differences. Medicine & Science in Sports & Exercise 20(5):474-478.
Sadres E, Eliakim A, Constantini N, Lidor R, and Falk B. 2001. The effect of long-term resistance training on anthropometric measures, strength, and self concept in pre-pubertal boys. Pediatric Exercise Science 13:357-372.
Sailors M, and Berg K. 1987. Comparison of responses to weight training in pubescent boys and men. The Journal of Sports Medicine and Physical Fitness 27(1):30-37.
Sale D.G S., L.L. 1996. Skeletal muscle function and energy metabolism. In: O. Bar-Or DRL, P.M. Clarkson editor. Exercise and the Female – A Life Span Approach. Carmel, IN: Cooper Publishing Group. p 289-359.
Sale DG. 1989. Strength training in children. In: Gisolfi CV, Lamb, D.R. , editor. Youth, Exercise and Sports. Carmel, IN: Benchmark Press. p 165-222.
Scerpella TA., Dowthwaite JN, and Rosenbaum PF. 2011. Sustained skeletal benefit from childhood mechanical loading. Osteoporosis International 22(7):2205-2210.
Schoenau E, and Frost HM. 2002. The “muscle-bone unit” in children and adolescents. Calcified Tissue International 70(5):405-407.
Siegel JA, Camaione DN, and Manfredi TG. 1989. The effects of upper body resistance training on prepubescent children. Pediatric Exercise Science 1:145-154.
Steelman J, and Zeitler P. 2001. Osteoporosis in pediatrics. Pediatrics in Review 22(2):56-65.
Tanner JM, Hughes PC, and Whitehouse RH. 1981. Radiographically determined widths of bone muscle and in the upper arm and calf from age 3-18 years. Annals of Human Biology 8(6):495-517.
Theintz G, Ladame F, Howald H, Weiss U, Torresani T, Sizonenko PC. 1994. L’enfant, la croissance et le sport de haut niveau. Schweizerische Zeitschrift fur Medizin und Traumatologie (3):7-15.
Theintz GE. 1994. Endocrine adaptation to intensive physical training during growth. Clinical Endocrinology 41:267-272.
Theintz GE, Howald H, Weiss U, and Sizonenko PC. 1993. Evidence for a reduction of growth potential in adolescent female gymnasts. Journal of Pediatrics 122(2):306-313.
Timmons BW, Bar-Or O, and Riddell MC. 2003. Oxidation rate of exogenous carbohydrate during exercise is higher in boys than in men. Journal of Applied Physiology 94(1):278-284.
Turley KR, Martin DE, Marvin ED, and Cowley KS. 2002. Heart rate and blood pressure responses to static handgrip exercise of different intensities: reliability and adult versus child differences. Pediatric Exercise Science 14:45-55.
Turley KR, and Wilmore JH. 1997. Cardiovascular responses to treadmill and cycle ergometer exercise in children and adults. Journal of Applied Physiology 83(3):948-957.
Van Praagh E, and Dore E. 2002. Short-term muscle during growth and maturation. Sports Medicine 32(11):701-728.
Vinet A, Nottin S, Lecoq AM, and Obert P. 2002. Cardiovascular responses to progressive cycle exercise in healthy children and adults. Internaional Journal of Sports Medicine 23(4):242-246.
Vogler C, and Bove KE. 1985. Morphology of skeletal muscle in children. An assessment of normal growth and differentiation. Archives of Pathology & Laboratory Medicine 109(3):238-242.
von Fukunaga T, Funato K, and Ikegawa S. 1992. The effects of resistance training on muscle area and strength in prepubescent age. Annals of Physiological Anthropology 11:357-364.
Vrijens J. 1978. Muscle strength in the pre-and post-pubescent age. Medicine and Sports Science 11:152-158.
Waugh CM, Korff T, Fath F, and Blazevich AJ. 2014. Effects of resistance training on tendon mechanical properties and rapid force production in prepubertal children. Journal of Applied Physiology (1985) 117(3):257-266.
Welsman J, and Armstrong N. 2008. Interpreting exercise performance data in relation to body size. In: Armstrong N, and Van Mechelen W, editors. Paediatric Exercise Science and Medicine. . New York: Oxford University Press. p 13-21.
Wilk B, Aragon-Vargas L, and Bar-Or O. 2001. Involuntary dehydration in children and adolescents following a triathlon race in a hot climate. Medicine & Science in Sports & Exercise 33:S137.
Wilk B, Yuxiu H, and Bar-Or O. 2002. Effect of hypohydration on aerobic performance of boys who exercise in the heat. Medicine & Science in Sports & Exercise 34:S48.
Willcocks RJ, Williams CA, Barker AR, Fulford J, and Armstrong N. 2010. Age- and sex-related differences in muscle phosphocreatine and oxygenation kinetics during high-intensity exercise in adolescents and adults. NMR in Biomedicine 23(6):569-577.
Williams JR, and Armstrong N. 1991. The influence of age and sexual maturation on children’s blood lactate responses to exercise. Pediatric Exercise Science 3:111-120.
Wilson GJ, Murphy AJ, and Pryor JF. 1994. Musculotendinous stiffness: its relationship to eccentric, isometric, and concentric performance. Journal of Applied Physiology 76(6):2714-2719.
Zafeiridis A., Dalamitros A., Dipla K., Manou V., Galanis N., Kellis S. 2005. Recovery during high-intensity intermittent anaerobic exercise in boys, teens, and men. Medicine & Science in Sports & Exercise 37(3):505-512.
About the Authors
Panagiota (Nota) Klentrou,Dept of Kinesiology, Faculty of Applied Health Sciences
Brock University

Dr. Panagiota (Nota) Klentrou is a professor in the Department of Kinesiology, and the Associate Dean Research and Graduate Studies of the Faculty of Applied Health Sciences at Brock University, Ontario, Canada. She received a BSc (1981) in Physical Education and Sport Science from the National University of Athens, Greece, and an MSc (1987) and PhD (1991) in Exercise Physiology from the University of Montréal, Québec, Canada. Her research program uses applied and basic science approaches to study human performance and the implications of sport training primarily in children and youth. With funding from NSERC, SSHRC, CIHR and other sports agencies, her current research projects examine how sexual maturation, exercise, inflammation, adiposity and nutrition affect musculoskeletal growth and development. In particular, this research is trying to identify the cellular mechanisms that explain how exercise training and dietary choices during childhood and adolescence affects skeletal and lifelong bone health. Dr. Klentrou is a leader in her field with >100 publications and >2,000 citations covering a range of topics in pediatric exercise physiology, exercise interventions, musculoskeletal growth and maturation, nutritional supplements and inflammation. A retired international rhythmic gymnast herself, she has been involved with many local, provincial, national and International organizations including Osteoporosis Canada, the International Gymnastics Federation and the Athens 2004 Summer Olympic Games. Dr. Klentrou served as Chair of the Board of Directors of the Canadian Society for Exercise Physiology 2013-2015 after serving 10 years (2003-2013) as Treasurer.
Bareket Falk, Dept of Kinesiology, Faculty of Applied Health Sciences, Brock University

Dr. Bareket Falk is a pediatric exercise physiologist, with a keen interest in children’s responses to exercise and the physiological effects that physical training may have on healthy children, as well as on children with chronic diseases. She obtained a Bachelor degree in Physical Education from McGill University in Montreal (1982), M.Sc. (1986) from Tel Aviv University, and Ph.D. (1991) from McMaster University. She headed the Physiology Department and the Sports Medicine and Research Centre at the Wingate Institute in Israel and is currently a professor in the Department of Kinesiology at Brock University.
Bareket has been teaching topics in growth and development, exercise physiology and specifically, pediatric exercise physiology for about 30 years at the undergraduate and graduate level.
Her recent areas of research include the effect of exercise and physical training on bone health and on neuro-muscular function during growth and maturation. She has published over 180 scientific papers and book chapters encompassing various areas in pediatric exercise physiology, including the effects of physical activity and training on growing bone and on muscle function, as well as in areas such as thermoregulation and metabolism.
