Chapter 14: Molecular Basis of Exercise Training Adaptations in Skeletal Muscle
David Hood; Nashwa Cheema; Ayesha Saleem; Heather Carter; Anna Vainshtein; Olga Ostojic; and Sobia Iqbal

Learning Objectives
- Understand the concept of adaptation as it relates to changes in gene expression;
- Appreciate the divergent signals and pathways that lead to adaptation in exercising muscle;
- Comprehend the details of gene expression and be able to converse about how changes in muscle adaptations apply to a real training setting.
Key Terms
muscle adaptation, gene expression, transcription, translation, protein synthesis, myosin heavy chain, mitochondrial biogenesis biogenesis, fibre types, electron transport chain, isoforms, NuGEMPs, transgenic, hypertrophy, endurance training, resistance training training, proteins, satellite cell, myonuclear domain, slow twitch, fast twitch, receptors (DHPR), creatine kinase (CK), myoglobin, heat-shock protein (HSP)-70, ROS, PGC-1α, Nuclear Respiratory Factor-1 (NRF-1), mTOR, nuclear factor of activated T-cells (NFAT), S6Kinase, IGF, SERCA, V̇O2max, ADP.
Case Presentation: A Look Inside the Muscle: The Metabolic Benefits of Training
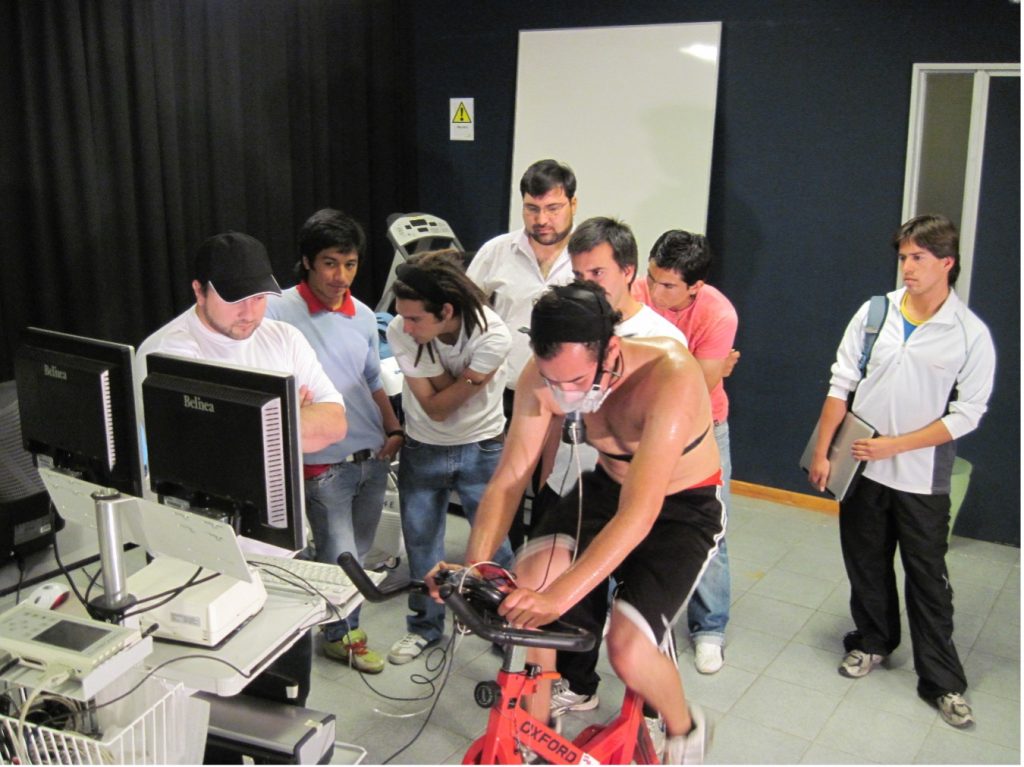
Andrew is a 26-year-old university graduate who has never been an elite athlete. In fact, he was recreationally active in only a few sports during high school and university, preferring to focus on his studies and academic achievements. His girlfriend Erin is sports-minded, and always participated in track and field in her youth. Now she finds running the occasional 10 km race rewarding since her track career has ended. Erin has convinced Andrew that his fitness level is on the low end of average, and that starting a training regimen (jogging and running) with the goal of completing a running race together might be a way to spend time together as well as to get fit. In fact, through her university connections, she has arranged a complete “work-up” and analysis of Andrew’s fitness, from the level of the muscle to his aerobic capacity. During a pre-test,V̇O2max would be assessed and micro-biopsy samples would also be taken to analyze the metabolic changes within the muscle during exercise before and after the training period. Erin has set up a progressive training program appropriate for Andrew’s starting fitness level beginning about 10 weeks prior to the race. Andrew underwent a graded exercise stress test before and after the training period in which and muscle biopsy samples are taken at various workloads.
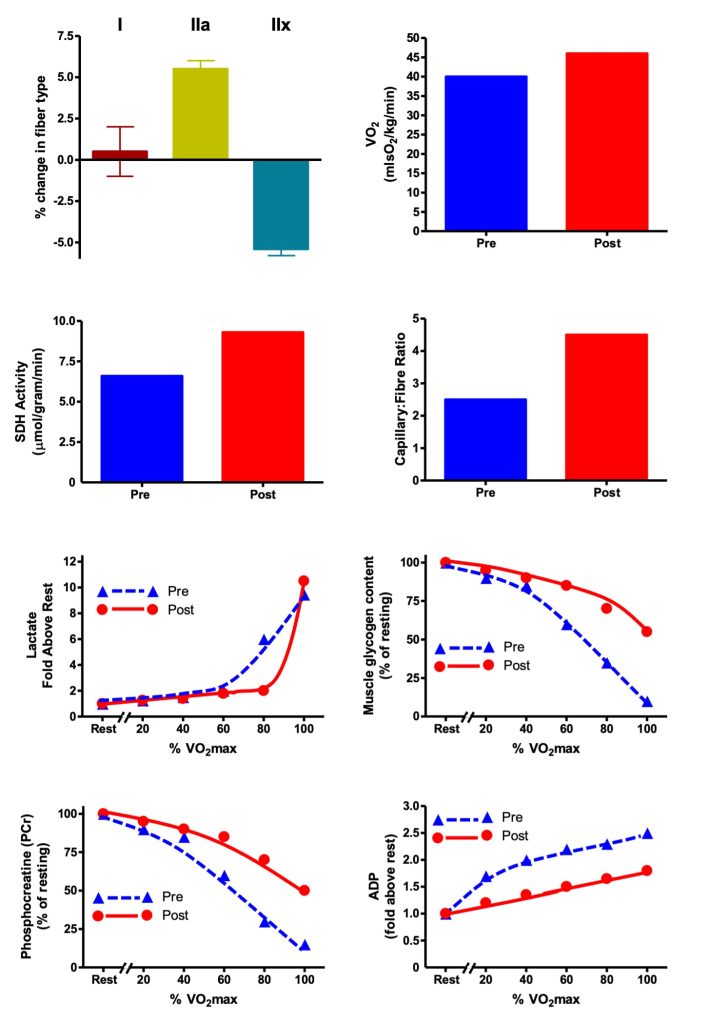
The results of Andrew’s training are illustrated in Figure 14-1. They are typical of changes from a previously untrained state to that of a more physically fit individual who faithfully adheres to a well-designed endurance training program. Andrew’s V̇O2max increased by about 10% and the proportion of his type IIa fibres increased at the expense of type IIx fibres. His proportion of type I fibres did not change, as expected. Typically, a transition to more type I fibres would take a much longer period of training (see later in this chapter). During graded exercise, Andrew displayed the beneficial metabolic adaptations of training, corresponding to improved endurance performance. Andrew used less glycogen during exercise and produced less lactate during the submaximal portion of the stress test. He also spared his use of phosphocreatine and the level of adenosine diphosphate (ADP) was reduced. This lower ADP concentration was a reason for the lower level of glycolytic stimulation. Mitochondrial marker succinate dehydrogenase was elevated, indicating that the training program increased mitochondrial content within the trained muscle. This adaptation would account for a better use of lipid as a substrate during exercise and contribute to the preservation of carbohydrate (COH) fuels like glycogen which must be preserved in order to perform well in endurance events. Andrew’s muscles have a higher oxidative capacity because they have more mitochondria. They also have more capillaries surrounding each muscle fibre which provide energy substrates and oxygen to the mitochondria. His endurance time is much more prolonged, and he is ready to run his race with Erin!
Gender BOX: Battle of the Sexes? It’s a Molecular Matter!
There is no denying that males and females differ vastly in their muscle structure, size, and ability to undergo hypertrophy in response to training. Males feature a greater free mass, a bigger muscle cross-sectional area, and more fast-twitch type IIA muscle fibres when compared with their female counterparts (Miller et al. 1993). Females, on the other hand, display superior resistance (Wüst et al. 2008) and a greater reliance on for energy production (Roepstorff et al. 2006). It has been postulated that these discrepancies are due to inherent hormonal differences between the two genders where men have 10-30-fold greater resting levels of testosterone while women are well-endowed with estrogen. Testosterone has the ability to enhance protein synthesis, ultimately contributing to muscle hypertrophy, while estrogen activates the synthesis of burning machinery. Does this mean that men adapt better to exercise training than women? Not necessarily! Several studies indicate that men and women undergo the same level of protein synthesis following an acute bout of resistance exercise despite dramatic differences in testosterone levels (West et al. 2012). Men and women also adapt similarly to high intensity interval training (Astorino et al. 2011). However, if the two sexes display similar adaptations to resistance training what accounts for the extensive increase in muscle size observed in men? Other than the hormonal differences, there also appears to be variations in gene expression between the two genders. The muscle transcriptome is vastly different between the two sexes both at baseline and following an acute bout of resistance exercise (Liu et al. 2010). The time course of the transcriptional modulation is also sex-dependent wherein males experience prolonged changes in gene expression while females exhibit rapid transitions (Liu et al. 2010). Thus, in addition to the hormonal divergence, transcriptional regulation might be at the root of the differential adaptations observed between the sexes following exercise training at the same relative intensity.
Introduction to the Types of Exercise Training
Exercise can be classified in a number of ways. Acute exercise refers to a single bout which can either be short (i.e. seconds) or long (several hours), and can vary in intensity from being mild, as in a light jog, to supramaximal, like a 100-meter sprint at top speed. A single acute exercise bout produces physiological and metabolic changes in the working muscle that, if repeated many times, can ultimately lead to an “adaptation”. When acute exercise bouts are repeated over and over again, this is referred to as exercise training. In order for exercise training to be effective, certain training principles must be adhered to. These include:
- the frequency of exercise per week;
- the duration of each exercise bout in minutes;
- the intensity of exercise, usually expressed in terms of %V̇O2max, or %max heart rate;
- the length of the training period in weeks or months.
These training principles should be applied regardless of the type of training employed. Traditionally, three forms of training have been recognized for many years. As reviewed below, these are:
Endurance Training
This type of training usually refers to repeated bouts of acute endurance exercise which employs a large fraction of available muscle mass. Commonly accepted exercise dosage for adults aged 18-64 years is to engage in moderate-to-vigorous intensity aerobic exercise (65-75% V̇O2max) for 30-40 minutes at a frequency of 3-5 days per week. More recently, the Canadian Society for Exercise Physiology has revised these guidelines to indicate that adults should aim to accumulate 150 minutes of exercise per week in bouts of 10 minutes or more. From a health perspective, this helps reduce the risk of chronic pathological maladies such as heart disease, stroke, obesity, type 2 diabetes and osteoporosis. Typical examples include brisk walking, jogging, running, swimming, cycling and cross-country skiing. These types of exercise produce transient increases in heart rate, cardiac output and peripheral muscle oxygen and substrate extraction, leading to an acute increase in above rest to a steady-state level which can be sustained for a prolonged period. When this is repeated 3-5 times per week for several weeks, endurance training benefits such as improved whole-body endurance and an increase in max, will accrue. The increase in endurance is a result of muscle adaptations to exercise, as outlined in this chapter.
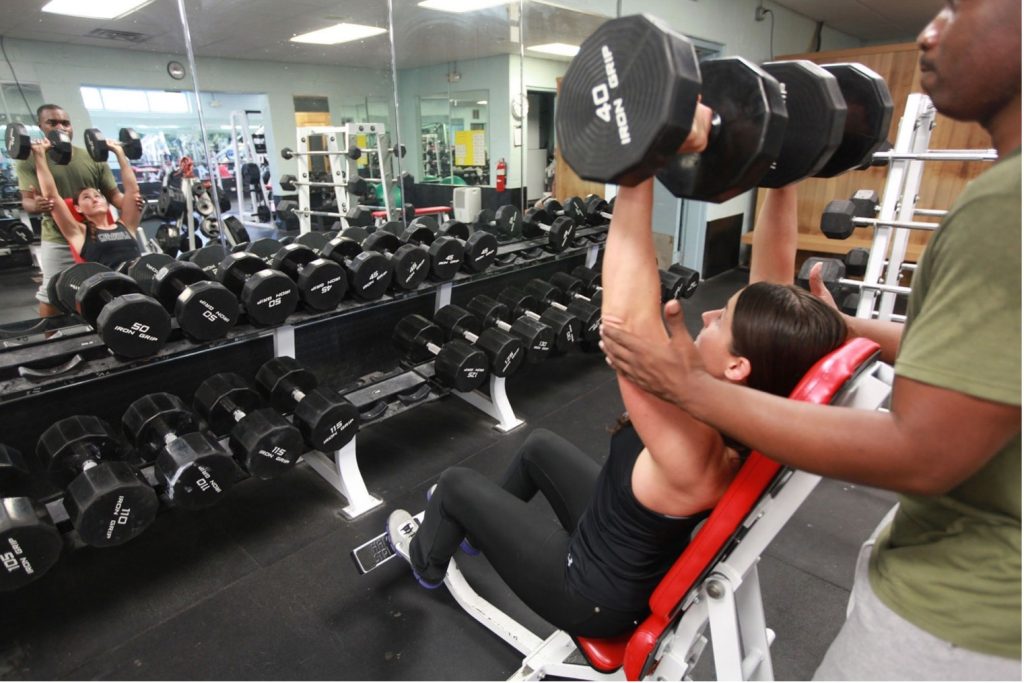
Resistance Training
Interval Training
This type of training has been well recognized for many years, and it has regained some popularity recently because of the adaptations that can be observed within muscle. Interval training usually entails the performance of vigorous or supramaximal intensity exercise over short intervals of time. An example of such training is repeated 400-meter sprints at a pace of 60 seconds (6.7 metres·s-1), done with a rest interval of 2 minutes between sprints. This represents a “work-to-rest” ratio of 1:2. Various work-to-rest ratios can be employed depending on the fitness of the subjects. Many, many different types of intervals can be imagined, tailored to the specificity of the sport or activity. A longer rest interval may permit a higher intensity in the next interval. During high intensity interval training, it is more likely that the rarely used Type IIx motor units within the muscle will be recruited. The fibres within these motor units adapt readily to exercise because they have a very low endurance to begin with. Not only are muscles and motor units within them heavily activated by such high intensity exercise but so are the respiratory and cardiovascular systems. High heart rates are common, and if the rest interval is short enough, the heart rate remains high even during the recovery period between bouts. This maximizes the cardiovascular benefits of such exercise. Known for its difficulty, interval training has recently seen a revival of interest from exercise physiologists who wish to minimize time spent training and maximize the benefits of high intensity exercise.
Subcellular Systems that Adapt to Training
Like most cell types in the body, muscle cells contain the organelles responsible for cell survival including a nucleus, ribosomes, endo- and sarcoplasmic reticulum, lysosomes, cytoskeletal elements and a cytoplasm with an abundance of proteins. The specialized elements within muscle cells that distinguish them from many other cell types include
- multiple myonuclei;
- a well-developed calcium handling system that responds with every action potential;
- myofibrillar proteins that produce force;
- three energy systems that provide rapid and sustained for muscle contractions.
Myonuclei
During embryonic development, stem cells commit themselves to form muscle cell precursors called myoblasts. Myoblasts have a single nucleus and lack proteins. Myoblasts then fuse together to form myotubes which are elongated immature muscle cells. When many myoblasts fuse together, they donate their individual nuclei to the growing, elongated myotube, forming a multinucleated muscle cell (Figure 14-2). As progresses, these nuclei express muscle-specific
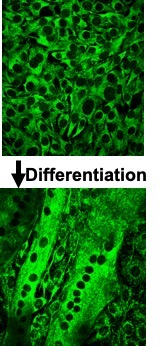
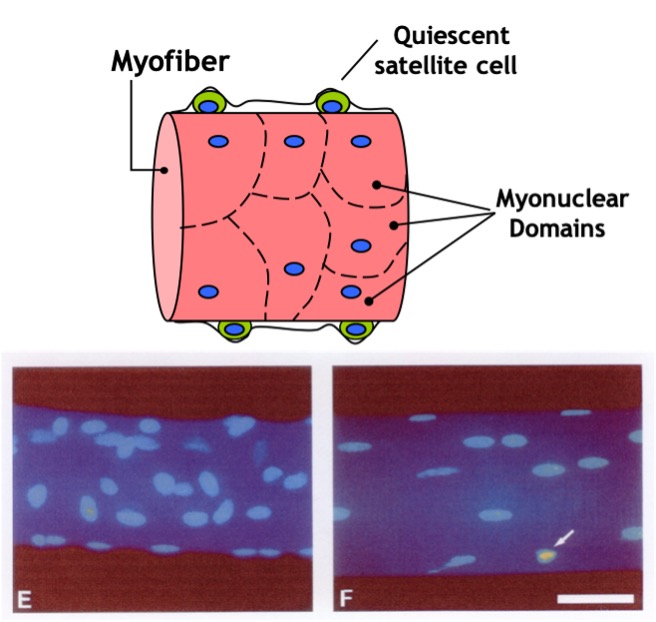
genes, such as and myosin, and the cell gains the ability to contract. Nuclei are necessary all along the muscle fibre as a single nucleus is only able to provide the DNA and building blocks necessary to sustain a certain volume of the cell. This volume is known as the myonuclear domain and it corresponds to the volume of cytoplasm governed by each individual nucleus (Figure 14-3). Multiple nuclei are necessary to provide sufficient machinery to support the full length of the muscle fibre. Thus, unlike most cells in the body which possess only one nucleus, mature muscle fibres have many. As we discuss muscle adaptations to exercise, we will continually refer to the genes within these nuclei and how these genes are “expressed” to give rise to specialized adaptations that we observe with training. In addition, as discussed below, the number of myonuclei in muscle can be altered by training, giving the cell the potential to increase gene expression to better support the needs of a growing muscle.
Myofibrillar proteins
Within the cytoplasm of muscle cells are organized bundles of proteins called myofibrils . These myofibrils contain
- proteins,
- structural proteins,
- cytoplasmic proteins,
- regulatory proteins.
Contractile proteins generally refer to and myosin, while structural proteins include titin, z-line proteins and nebulin. Regulatory proteins are those which “control” the contraction process. These include troponin and tropomyosin (Figure 14.4). Both the contractile and regulatory proteins exist as multiple “isoforms” within muscle fibres. Isoforms are variants of the same protein, but with a slightly different primary amino acid sequence. This gives them a different physiological capability within the cell. Some physiologically-relevant isoforms that exist within muscle are listed in Table 14-1.
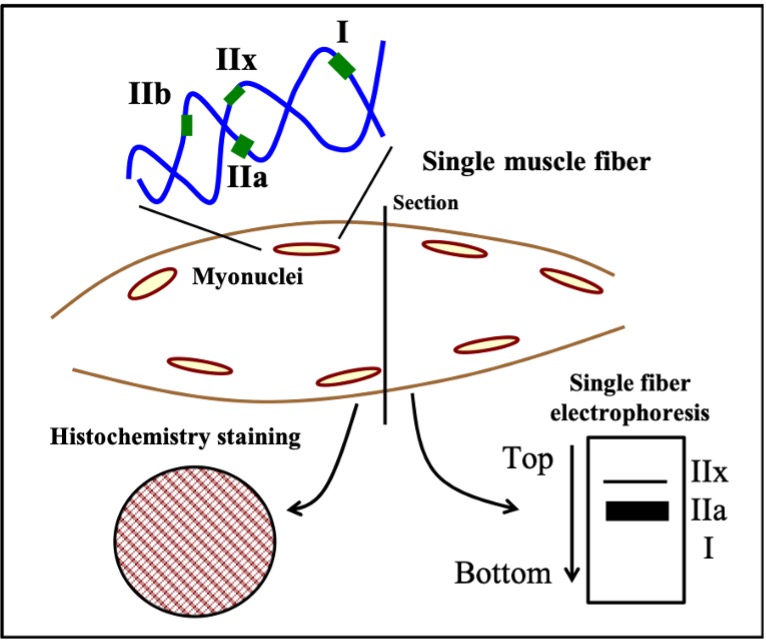
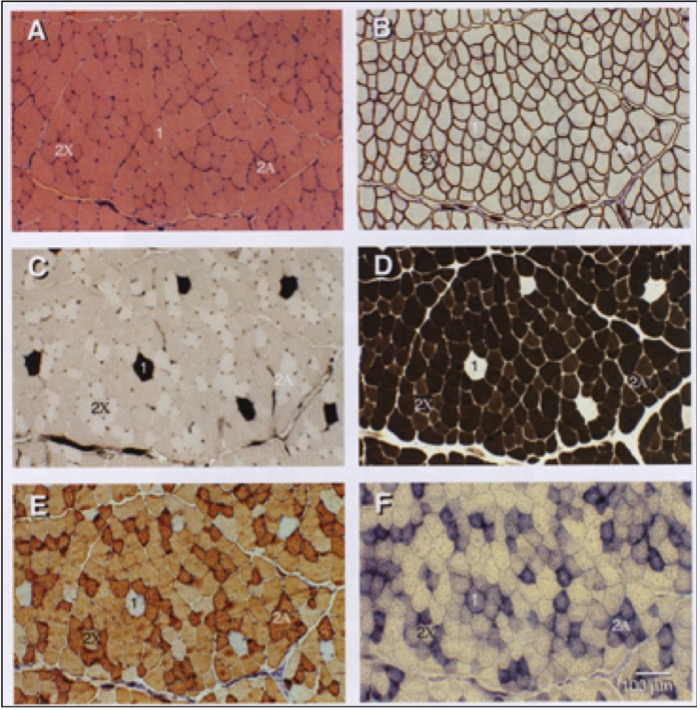
Mammals possess four genes that encode MHC isoforms that are expressed in adulthood. These are the MHC Type I, IIa, IIx and IIb genes (Figure 14-5). The MHC isoforms were discovered based on their different molecular weights when they are separated using a technique called electrophoresis, which distinguishes proteins based on their size. It is now known that only three of these four genes are expressed in adult human muscle and that the fourth, the MHC Type IIb, is only expressed in smaller mammals, like rabbits, rats and mice. The abundance of these proteins in muscle fibres can be very high, giving rise to the idea that muscle “fibre types” can be classified based on how much of each isoform is present. For example, a type IIa fibre contains mostly MHC IIa. Because MHC IIa is a fast isoform of MHC, this means that a type IIa fibre is a fast-twitch fibre. In contrast, a fibre composed of mostly MHC I is a slow-twitch fibre because this MHC has a slow rate of breakdown. The abundance of these isoforms is typically detected using histochemistry which yields a qualitative analysis of the muscle fibres (Figures 14-5, 14-6). However, more quantitative analyses based on single fibre electrophoresis reveals that many muscle fibres, referred to as hybrid fibres, express multiple MHC isoforms. Our classification of Type I, IIa and IIx fibres is really an oversimplification of what really exists in muscle. Nonetheless, the classification into these three fibre types remains useful in general.
A question that often arises in exercise physiology is “Can fibre types be changed with training”? To do this, one would have to train at a sufficient exercise intensity, duration and frequency, and for a long period of time to induce a change in the expression of the MHC genes. Once we learn about the gene expression pathway (below), this fascinating topic will be considered once again.
Sarcoplasmic Reticulum (SR) Proteins
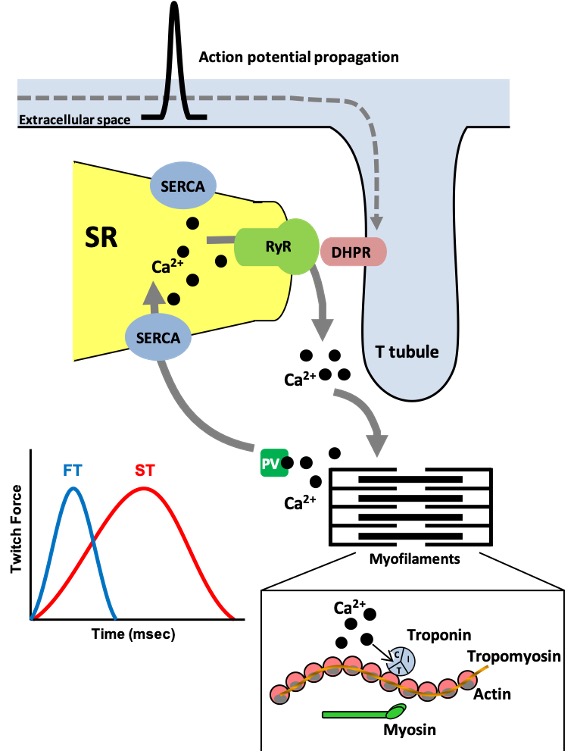
As discussed in earlier chapters on muscle contraction, when an action potential within a muscle fibre occurs, the change in voltage across the plasma membrane propagates along the plasmalemma and down the t-tubule which is continuous with the plasmalemma (Figure 14-4). Embedded in the t-tubule membrane are proteins called dihydropyridine receptors (DHPR). These are voltage sensitive and alter their conformation when an action potential occurs. The DHPRs physically interact with the calcium release in the SR, also called the ryanodine receptors (RyR). An action potential causes conformational changes in these two proteins including the opening of the RyR to permit a burst of calcium to be released into the cytoplasm. When action potentials cease, calcium release channels close and the calcium in the cytoplasm is taken back up into the SR in an ATP-dependent process catalyzed by the sarco/endoplasmic reticulum calcium- ATPase (SERCA) which, like MHCs, also exist in different isoforms. SERCA1a is the primary isoform present in adult fast-twitch skeletal muscle whereas SERCA2a is highly expressed in slow-twitch muscle and heart. SERCA3 exists in many cells of the body. SERCA-mediated calcium uptake allows cytoplasmic calcium to return to resting levels and causes the muscle to relax (Figure 14-4).
A number of these proteins have the potential to adapt to training though the study of SR proteins is not as advanced as for the myofibrillar or metabolic proteins. Endurance exercise training appears to reduce SR calcium uptake and release. Several proteins involved in SR calcium cycling undergo alterations resulting in this effect. For example, decreases in the content of the fast isoform SERCA1a and the RyR protein have been noted, which would tend to reduce the speed at which calcium is handled within endurance-trained muscle.
|
Protein |
Isoforms |
Functions |
Distinctions |
|---|---|---|---|
|
Myosin heavy chain (MHC) |
MHC I MHC IIa MHC IIx |
Catalyze the breakdown of ADP during the crossbridge cycle, when myosin is bound to actin |
MHC I has a slow rate of breakdown, whereas isoforms IIa and IIx catalyze fast breakdown |
|
Actin |
Alpha-actin Gamma-actin |
α- is a protein involved in the crossbridge cycle, whereas γ- is a cytoskeletal protein involved in maintaining the shape of the cell |
|
|
Lactate dehydrogenase |
M-LDH H-LDH |
M-isoform catalyzes the reaction of Pyruvic acid + NADH Lactic acid + NAD+ |
The H-isoform catalyzes the reaction in the opposite direction |
|
Sarcoplasmic-endoplasmic reticulum ATPase |
SERCA 1 SERCA2 |
Catalyze the uptake of calcium back into the sarcoplasmic reticulum following the contraction phase. This uptake produces muscle relaxation |
SERCA1 is found in fast-twitch, Type IIa and IIX fibers. SERCA2 is found in slow-twitch f ibers |
Cytosolic Proteins
There are a number of different types of proteins within the cytoplasm but the most studied are those which are involved in energy metabolism, particularly enzymes of glycolysis or the metabolism of phosphocreatine (i.e. creatine phosphokinase, or CPK). These enzymes have a very high specific activity in muscle fibres, much higher (10-fold!) than those enzymes devoted to oxidative metabolism in the mitochondria, for example. A large number of studies have been conducted which have evaluated the effects of training on the activity of these enzymes and most indicate very little effect, regardless of whether endurance, sprint or resistance training methods are employed.
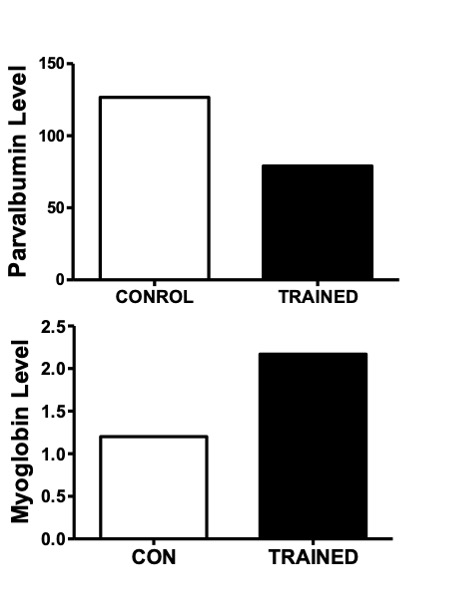
In addition to metabolic enzymes, two other proteins which serve a “chaperone”-like role are responsive for changes in muscle activity. These are parvalbumin, a calcium binding protein, and myoglobin (Mb), a protein which binds oxygen. These proteins are chaperones in the sense that they facilitate the transport of their ligands (i.e. calcium or oxygen respectively) to the site of where they are needed. For example, parvalbumin facilitates the diffusion of calcium to the SERCA pump for removal from the cytoplasm. This protein is considered to be important for the relaxation phase of muscle contraction and it is very high in concentration in fast-twitch muscle fibres and low in slow-twitch muscle fibres. Myoglobin, on the other hand, helps to transport oxygen from the periphery of the muscle fibre to the where it can be used in phosphorylation, the aerobic production of ATP. Myoglobin is highly abundant in slow-twitch and Type IIa fibres. These fibre-types have a red colour due to the presence of Mb which contains the red pigment, heme. In response to chronic endurance training, parvalbumin tends to decrease in the cell while Mb is usually found to increase (Figure 14-7).
A third class of proteins are referred to as stress proteins, typified by the heat-shock protein-70 (HSP-70). These proteins are induced very rapidly in response to a variety of stressors including exercise. Their main function appears to be in protein refolding. Any protein that is denatured, or unfolded, during a stressful cellular condition loses its function. This undermines the health of the cell. HSP70 has an active role in preventing cellular death by helping to restore protein shape and function.
Mitochondrial Proteins
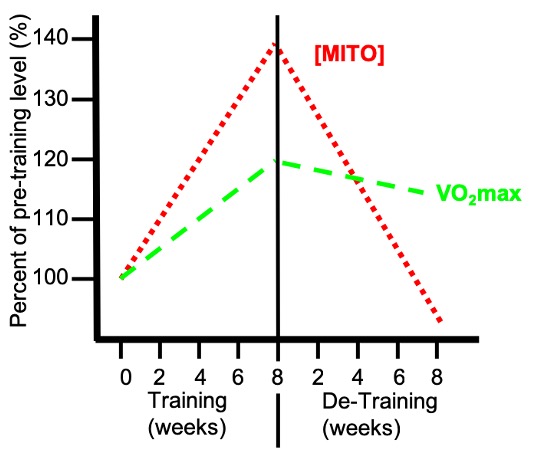
Mitochondria are the “powerhouses” of the cell because they are the source of most of the that is used to fuel muscular contraction. The proteins within are those involved in the oxidation of pyruvic acid, derived from glycolysis, and β oxidation, the breakdown of fatty acids from triglycerides derived from within the muscle cell itself or originally found within adipose tissue. The proteins ultimately responsible for this metabolism are the enzymes of Krebs’ Cycle and the electron transport chain (ETC) as described earlier (Chapter 6). One of the most dramatic adaptations to regularly performed exercise training is the uniform increase of many enzymes involved in β-oxidation, Krebs’ Cycle and the ETC. This occurs in the muscle fibres that are recruited, or used, during the training period. For example, in response to training of relatively mild intensity (i.e. jogging), the muscle fibres that are predominantly used during this exercise will adapt and produce more mitochondrial proteins. These fibres would include type I and IIa, but probably not the Type IIx fibres which are only activated during intense exercise bouts. It is also important to realize that mitochondrial adaptations are lost rather rapidly once a training regime ceases (Figure 14-8). Since mitochondrial adaptations closely correlate with endurance performance and measures of aerobic fitness, it is important to maintain a level of physical activity to avoid losing these adaptive changes.
There are many benefits of mitochondrial adaptation including an improvement of lipid metabolism and a reduction in the reliance on COH as energy sources during prolonged exercise. This is important because of the limited (gram) quantities of COH stores within our muscles and liver. In contrast, an increase in allows us to take greater advantage of the (kilogram) quantities of stores within our adipocytes and muscle cells. In addition, having more means that we can rely less on glycolysis and phosphocreatine as energy sources during intense contraction conditions. This reduced reliance on these pathways means that we produce less lactic acid during exercise, glycogen is used at a slower rate, and phosphocreatine breakdown is diminished. These adaptations have important benefits for endurance performance. A perfect example of this is shown in the Case Study at the start of this Chapter. Traditionally, this kind of adaptation has been observed with endurance training, but more recently it has been shown to occur with different forms of sprint training, which produce adaptations in type IIx fibres as well.In order to understand how these adaptations in muscle occur, it is important the review the pathway of gene expression and how it is activated in response to different exercise stimuli. Gene expression is the precursor to protein synthesis; therefore, both processes are crucial for muscle adaption with exercise.
Highlight BOX: The “Secret” of Muscle
Within the last 10-15 years, numerous studies have shown that muscle tissue is capable of producing and releasing hundreds of different proteins (Bortoluzzi, (2006). The ability of skeletal muscle to secrete factors provides a method for communication. The signaling molecules that are released have been called “myokines” (Pedersen, 2008). These secreted signals can travel in the blood and affect other tissue types, well known as an endocrine effect. Secreted myokines may also remain local and work to cause changes within the muscle itself. This is known as an autocrine or paracrine effect. While not all of the proteins secreted from muscle have been identified yet, the IGF (insulin-like growth factor) family, IL-6 (interleukin-6), and most recently irisin (named after the Greek messenger goddess, Iris), have all been accepted as myokines.
The IGF family consists of many proteins. In skeletal muscle, IGF-I and IGF-II can be secreted and act back on the muscle in an autocrine/paracrine manner. IGF-II seems to promote the formation of muscle during development (Florini , 1991). In adults, IGF-I is capable of increasing muscle size (i.e. hypertrophy) as well as promoting muscle repair through the activation of satellite cells (Barton, 2006).
IL-6 was among one of the first- ever myokines to be identified. It was discovered that IL-6 was released from muscle during exercise, and that plasma blood levels could increase up to 100-fold! (Steensberg, 2002). This increase in IL-6 depends on both the exercise intensity and duration. Increased muscle-derived IL-6 triggers breakdown (lipolysis) and utilization (fat oxidation) in other tissues. Mice that lack IL-6 become obese and resistant (Pedersen, 2008 ).
The latest myokine to be identified is irisin. Irisin production is regulated by a protein called PGC-1α which is a critical factor for exercise adaptations in skeletal muscle (Boström , 2012). It is very well known that PGC-1α and circulating levels of irisin both increase with exercise. Once released from the muscle, irisin is able to travel to the adipose tissue where it will stimulate the to increase energy expenditure which will be released as heat. Administration of irisin to rodents is also shown to stimulate weight loss and prevent insulin resistance. Thus, production of the myokines IL-6 and irisin are important signals from the muscle that coordinate the beneficial adaptations to regular exercise such as weight loss and resistance to metabolic disease.
The Gene Expression Pathway that Mediates Muscle Adaptations to Exercise
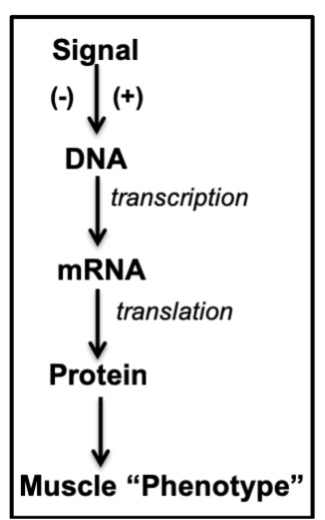
One way to produce an adaptation within a tissue in response to a stimulus is to either activate or inhibit the gene expression pathway (Figure 14-9). This usually means that the stimulus has to initially modify gene transcription. The mRNA that results is translated into protein which contributes to changing the “phenotype” or appearance of the muscle cell. For example, if the transcription of MHC Type I is increased, then the muscle will become slower in its contractile properties. If the transcription of a mitochondrial lipid oxidation enzyme is increased, increased protein levels of the enzyme will cause the muscle to begin to favour lipid over COH metabolism.
What are typical stimuli that result in adaptations within skeletal muscle? Exercise is one, of course, but muscle also responds to conditions such as hypoxia, hibernation, heat and cold exposure, altitude, muscle disuse, and nutrient deprivation, to name a few. Indeed, muscle is considered to be highly “plastic”, meaning that it adapts readily to a number of external stimuli. In this chapter, we will consider only the adaptive response to exercise. While adaptations to any stimulus take time, you may be surprised to learn that even the first exercise bout can initiate the adaptation process.
There are several levels of “control” over this pathway, generally classified into
- transcriptional; and
- post-transcriptional regulation.
Transcriptional control is exerted within the nucleus, while post-transcriptional regulation can take place in the nucleus, cytoplasm or within organelles of the cell.
The Signals Involved in Triggering Muscle Adaptations to Exercise
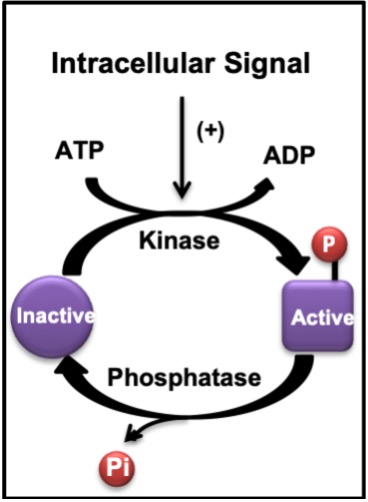
The adaptation process begins with the response of muscle cells to the first seconds of an acute bout of exercise. Signals are transmitted from one protein to another via physical interactions which lead to changes in protein shape (i.e. conformational changes). Often these interactions arise because of the actions of an enzyme like a kinase that phosphorylates a protein or a phosphatase which removes a phosphate group (Figure 14-10). This is a very common method of transmitting a signal within a cell in response to a stimulus, like exercise, or hormone treatment, for example.
There are six possible signals to be considered that occur in muscle at the start of each exercise bout (Figure 14-11):
Voltage-sensitive proteins
When a motor unit is recruited and muscle cell membranes are depolarized, a voltage signal travels across the plasmalemma. Many proteins within the muscle membrane system are voltage-sensitive (e.g. Na+ channels, receptors) and their conformation is altered in response to differences in voltage. When that happens, they can often interact with other proteins to begin a signaling cascade.
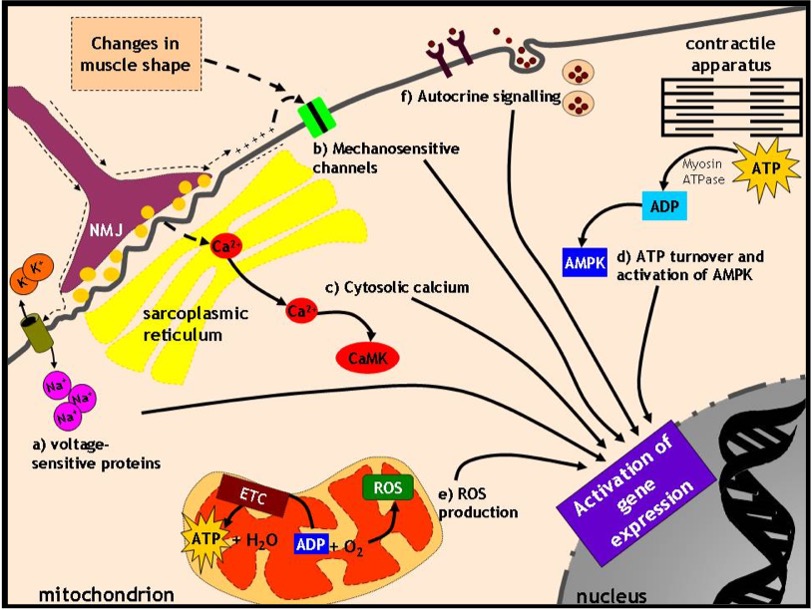
Mechanosensitive proteins
When a muscle cell contracts, a number of proteins are activated in response to changes in the shape of the muscle cell. In other words, they respond to mechanical deformation and trigger further protein activation “downstream”.
Cytosolic calcium
The propagation of the action potential causes the release of calcium from the SR. While calcium is important for mediating the contraction process, it is also a powerful activator of a number of kinase and phosphatase enzymes that can modify proteins by phosphorylation or dephosphorylation.
ATP turnover and the activation of AMP kinase
When calcium binds to troponin and permits and myosin to interact, is broken down to ADP and some ADP is further converted to AMP. AMP is an allosteric activator of the enzyme AMP kinase (hence its name!) which phosphorylates a number of transcription factors or other proteins which regulate transcription processes within the nucleus by binding to DNA in a sequence-specific manner.
Reactive O2 Species (ROS) production
ADP is the most important activator of phosphorylation (i.e. O2 consumption and production in the mitochondria). When O2 consumption is increased, a small percentage of the O2 forms reactive oxygen species (ROS) instead of being converted to water. These molecules can be damaging when present in excess or beneficial when produced in moderate amounts since they can serve to oxidize and activate proteins.
Secreted proteins acting in autocrine fashion
When a muscle cell contracts, a number of myokines are secreted from the muscle cells into the extracellular space. These molecules may act on specific receptors on the surface of the muscle cell which secreted them, termed autocrine signaling. The binding of the myokine to its receptor triggers a series of signaling events, usually phosphorylation reactions, which activate proteins to modify gene expression. An excellent example of this is the secretion of insulin-like growth factor-1 (IGF-1) from muscle cells, which then triggers protein synthesis in muscle cells. Some newly discovered myokines that are released upon exercise include interleukin-6 (IL-6) and irisin. These circulate in the blood and can have metabolic effects in other tissues. Thus, muscle not only produces molecules that have autocrine effects, but can act as an endocrine organ as well! (See the Highlight Box for additional details).
Gene Expression and Splicing
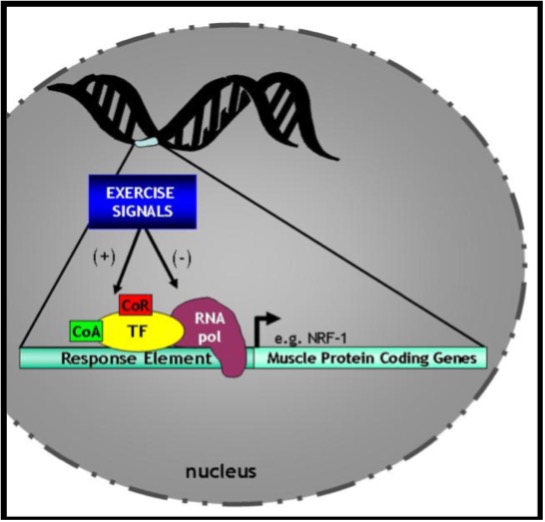
The activation of proteins by any one of these six mechanisms can lead to a change in their shape and location within the cell. In the case of proteins such as transcription factors, random movements within the cell can allow them to be translocated from the cytosol to the nucleus. There, these transcription factors bind DNA within the control region of genes in a sequence-specific manner. The particular sequence to which a transcription factor binds is called the response element or transcription factor-binding site (Figure 14.12). Recall that the structure of genes includes DNA which is “coding” (i.e. exons) and that which is non-coding (introns). Upstream of these gene segments is the control region called the promoter of the genes. It is usually within this upstream region that transcription factors bind to either facilitate or inhibit, the activity of RNA polymerase, the enzyme that actually transcribes the DNA into mRNA. Additional proteins such as co-activators and co-repressors work in tandem with the transcription factor to activate or repress the expression of the gene of interest. Co-activators and co-repressors do not directly bind to the DNA, but instead interact with the transcription factor itself to affect its action on gene expression. Thus, the ability of the signals described above to activate or inhibit transcription factors, and the consequent effects on genes within the nucleus, are the key elements of transcriptional control of the gene expression pathway.
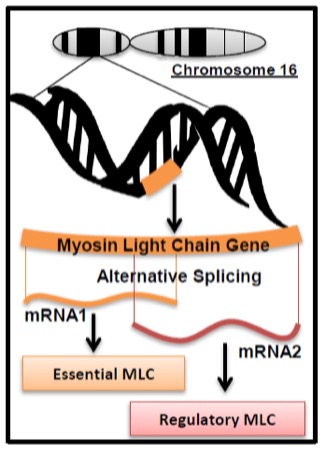
Once a gene has been transcribed, the mRNA is referred to as the primary transcript. This transcript still contains intronic regions of the gene and is subject to the process of splicing within the nucleus to remove these non-coding regions. This activity is controlled by splicing proteins. Different cell types (e.g. liver or heart or muscle) can splice a primary transcript differently depending on the activity of these splicing proteins. This can lead to mature mRNA sequences which differ from one another in different tissues, thereby coding for tissue-specific variations in the protein derived from that gene. This is a mechanism of producing divergent isoforms of proteins as discussed earlier in the chapter. Thus, one gene does not always encode one protein; different isoforms can represent more than one gene product from the same gene. Some isoforms arise from different genes (e.g. myosin heavy chain genes) while others can be derived from the same gene. An example of this is the fast myosin light chain gene within muscle (Figure 14-13).
mRNA Stability and Translation
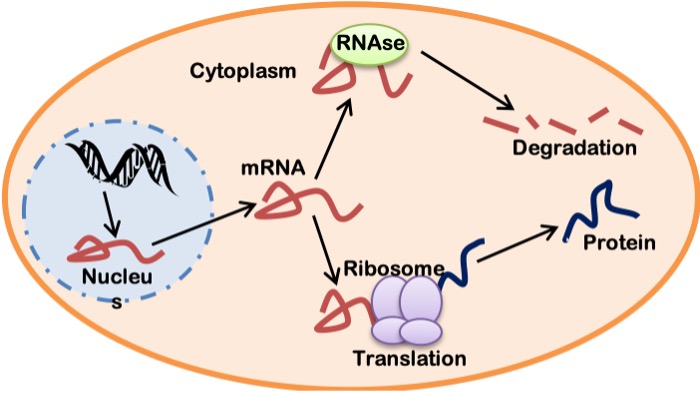
The mature mRNA, once formed in the nucleus, is exported via nuclear pores into the cytoplasm where it can follow a number of paths. It can be protected, stabilized and then translated into protein. Alternately, it can be subject to degradation by RNAses within the cytoplasm. Thus, the fate of an mRNA molecule is a result of competition between stabilizing and degradative factors in the cytoplasm of the cell (Figure 14-14). Assuming that the translation process wins out, the initiation of translation is the “rate-limiting” step in the formation of a protein. Translation initiation is mediated by factors which require activation by signals similar to those described above for transcriptional activation. It involves the assembly of the ribosomal subunits around the mRNA and the start of ribosome movement down the mRNA molecule. The ribosome “reads” the mRNA one triplet codon at a time and permits the insertion of charged tRNAs to enter with their corresponding amino acid at each mRNA codon. This is the elongation phase of translation. Ribosomal proteins then assemble the growing polypeptide chain, one amino acid at a time, as the ribosome moves along the mRNA. When the termination codon is reached, no new tRNA is attached, and the polypeptide chain is released as a newborn protein molecule.
Protein Trafficking and Assembly
New proteins can be inserted as they are made into the endoplasmic reticulum (ER) of cells for further modification. This is called co-translational trafficking. The ER contains enzymes which can post-translationally modify proteins to increase their activity. These modifications include the cleaving of inactive regions of the protein or adding COH residues to the protein (i.e. a glycosylation reaction), to name a few. Alternatively, the newly-made protein can be bound by chaperone proteins which serve to traffic the protein to its correct location. An example of this is the movement of a protein from the cytoplasm to the mitochondrion (see below). Chaperones are bound to this newly synthesized protein at specific locations within the polypeptide sequence and they serve to target the protein to its correct location based on the amino acid sequence found within it. Thus, a chaperone acts like a taxi cab, serving to direct a protein to its correct location within the cell while the “driver” of the cab is the targeting sequence found on the protein which tells the taxi, or chaperone, where to go.
Examples of Exercise-Induced Adaptations in Muscle
Myosin Heavy Chain Isoform (MHC) Expression and Muscle Fibre-Type Conversions
As noted earlier, myosin heavy chains exist in several predominant isoforms within muscle. These include the MHC Type I, IIa and IIx, and they are so abundant in muscle that their expression determines the muscle fibre types of the same name. MHCs are large proteins of approximately 200 kDa in size. They are encoded by separate genes within the genome which lie in tandem beside each other on chromosome 17 (Figure 14.13). The factors that determine the expression of these genes are of great interest to exercise physiologists and fitness buffs alike. If we knew how to activate the expression of these genes, we could potentially switch fibre types and improve performance, or muscle health, at will.
What is the evidence that exercise can produce an adaptation in MHC gene expression, and therefore in muscle fibre types? There is plenty of evidence, but the result may not be what you expect. Recall that there are three main muscle fibre types, Type I (slow-twitch), Type IIa (fast-twitch) and Type IIx (also fast-twitch). These are so named because of the abundance of MHC isoforms (of the same name) within these fibres as detected by histochemical staining. In order for a fibre type “switch” to occur as result of training, the expression of the predominant MHC isoform within that fibre has to be reduced while that of another MHC isoform has to be increased.
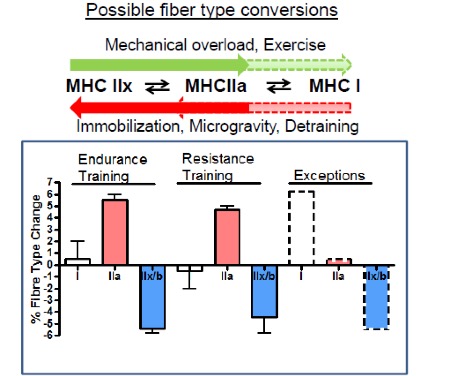
Evidence from histochemical studies reveals that both endurance and resistance exercise training result in the same fibre type shift. The abundance of the Type IIx fibres is reduced and that of Type IIa fibres increases (Figure 14-15). There is very little evidence for conversion of fast- to slow-twitch fibres with the regular training regimens imposed on human muscle, though a few exceptions to this general rule have been documented in the literature. That being said, plenty of evidence for a slow-to-fast fibre type conversion exists in other mammals subjected to artificially-imposed chronic electrical stimulation for up to 24 hours per day. In those cases, the workload that is imposed on the muscle is much higher than we, as humans, impose on our muscles. In those cases, the result is a successful conversion to slow muscle fibres due to a change in the expression of the MHC genes. This suggests that it may ultimately be possible in humans as well. Note that opposite conversion, that of Type IIa to Type IIx fibres, can occur in humans, and this is generally observed under conditions of chronic muscle disuse such as that brought about by immobilization, denervation, or prolonged inactivity.
Why is it then that superb, elite endurance athletes (e.g. high level marathoners) have a high proportion of slow-twitch fibres, and that elite performers (e.g. Olympic-caliber sprinters) have a large fraction of fast-twitch fibres in their locomotory muscles? These endowments were not brought about by training but are a result of “genetics”. While these athletes have the same complement of genes as normal healthy non-athletes, the expression of those genes has differed for those athletes ever since they were born. These athletes have a different pattern of gene expression than most other individuals either because of
- subtle differences in the sequence of DNA that controls gene expression (i.e. in the promoter region); or
- differences in the sensitivity of the gene expression pathway, at any of the levels that we have discussed above, to intracellular signals.
This was likely inherited to a large degree and modified slightly by training and environmental influences. Hence, we refer to this difference as “genetic”.
Mitochondrial Biogenesis and Endurance Performance
Early findings
In the late 1960s, John Holloszy and his colleagues at Washington University in St. Louis were the first to show that endurance training produced an increase in mitochondrial content within muscles that had been recruited during the training period. This pioneering study led to an outpouring of research in this field, and it is now a well-known fact that the mitochondrial adaptations to training have a large number of performance benefits. These include a better use of lipid as a fuel during long-term exercise and the sparing of COH stores as well as a lesser production of lactic acid, leading to an improved endurance performance.
Molecular basis for these changes
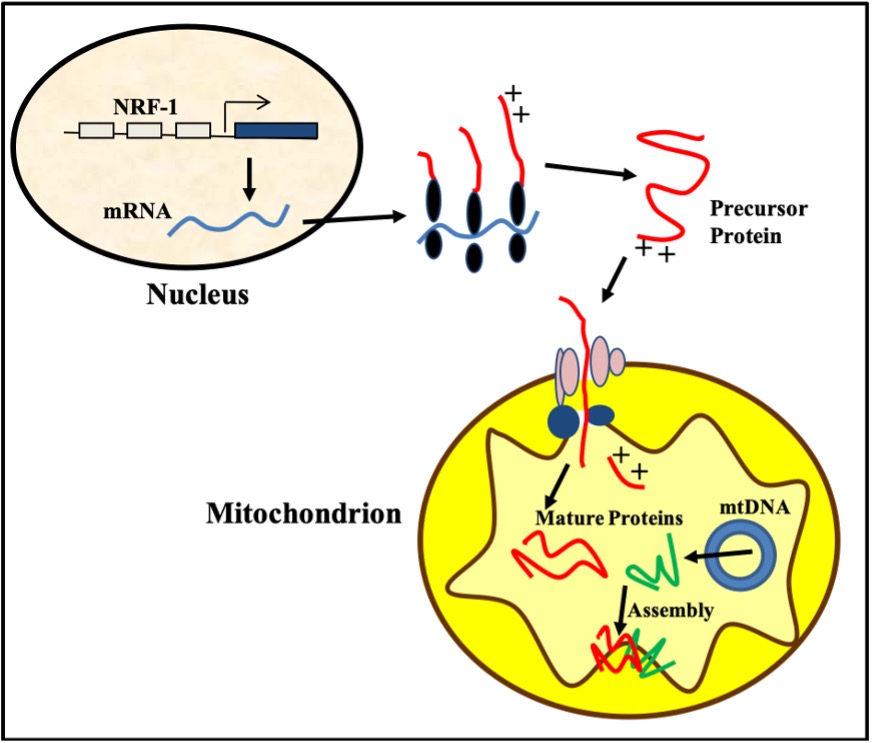
Figure 14-16 illustrates the complexity of the process of mitochondrial biogenesis produced by exercise. This process requires the coordinated synthesis of over 1500 proteins to expand the mitochondrial network within muscle cells. Mitochondria are unique in that they possess their own DNA, termed mitochondrial DNA (mtDNA). This genome is very small, encoding only 13 proteins. Thus, the remainder (about 1487 proteins!) must be coded for by nuclear DNA and synthesized in the cytoplasm via translation and then imported via specific channels into the mitochondrion. These imported proteins include Krebs’ cycle enzymes, proteins within the electron transport chain (ETC), and many others that the organelle requires to make ATP. Imported proteins, along with those derived from mtDNA, are then assembled to form multi-subunit complexes which are required for the to function. Exercise is known to increase the transcription of nuclear genes encoding mitochondrial proteins (NuGEMPS), and to increase the transport of newly synthesized proteins into the mitochondrion. Exercise also increases the number of copies of mtDNA within the organelle, thereby increasing the capacity for mitochondrial biogenesis.
How does exercise do this? The signals evoked by exercise provoke an increase in the expression and activity of PGC-1α (Figure 14-16). PGC-1α is considered to be a “master” regulator of mitochondrial synthesis. It facilitates the transcriptional activity of a large number of transcription factors in the nucleus including Nuclear respiratory factor-1 (NRF-1). NRF-1 transcribes a whole host of NuGEMPs, and the mRNAs encoded then escape the nucleus and are translated into protein in the cytoplasm. Some examples of these proteins include cytochrome c and subunits of the electron transport chain.
The importance of PGC-1α in mediating these adaptations in muscle is evident from animal studies in which mice are genetically engineered to have too much PGC-1α (i.e. Transgenic overexpressing animals), or too little (i.e. Knockout mice). These types of genetic manipulations in animals have proven to be extremely useful in medical science research. In the transgenic overexpressing animals, the muscle mitochondrial content is much higher than normal and so is the endurance performance. In contrast, in the knockout animals’ mitochondrial content is reduced and performance is impaired. Thus, it is clear that an understanding of how PGC-1α works in the cell can have a big impact on our knowledge of muscle adaptations.
Muscle Hypertrophy
Muscles enlarge in our bodies by undergoing hypertrophy as a result of an increase in the size of each individual muscle cell. Muscles typically do not divide or multiply, a process termed hyperplasia -they simply enlarge. The growth of individual muscle cells commonly occurs with resistance training that is performed with an appropriate intensity and duration as discussed earlier. The hypertrophy occurs as a result of two major types of events:
- anabolic processes; and
- satellite cell activation, fusion and donation of new myonuclei.
The result is an increase in the number of contractile myofibrils as a consequence of increased expression of myosin, and regulatory protein genes that comprise the majority of the proteins within muscle cells. This muscular hypertrophy causes myofibrils to thicken and then divide, making more myofibrils. The increase in mass and cross-sectional area of a muscle is directly proportional to its ability to produce force.
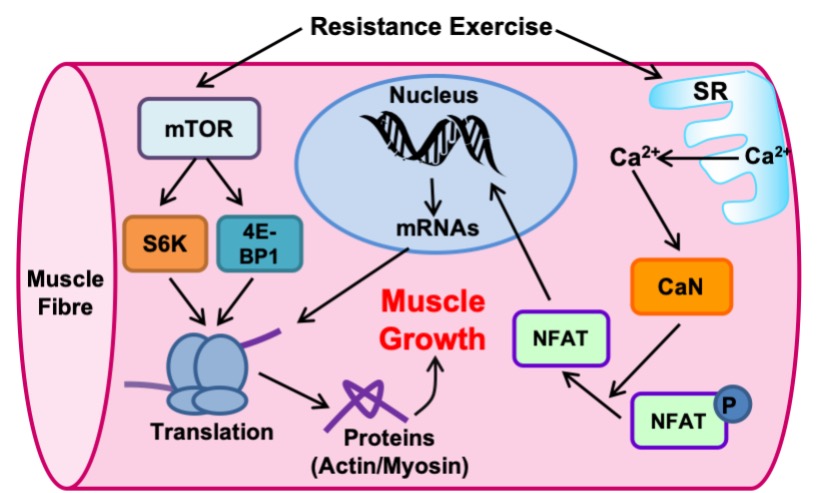
Anabolic Pathways
These pathways are activated by resistance exercise and lead to an increase in protein synthesis. They involve a number of important signaling proteins. One of these proteins, called mTOR (mammalian target of rapamycin), plays a crucial role in the formation of new proteins. The mTOR protein is a kinase which phosphorylates and activates proteins such as S6Kinase and 4E-BP1 to activate translation (Figure 14-17). Calcium is also an essential player for skeletal muscle hypertrophy. With the release of calcium from the SR with every muscle contraction, calcium can activate a protein phosphatase called calcineurin. In contrast to mTOR, calcineurin removes phosphate groups from other proteins, particularly the nuclear factor of activated T-cells (NFAT), a name derived from the cell type in which it was originally discovered. When the phosphate group is removed from NFAT, it becomes free to enter the nucleus and increase the transcriptional activation of genes important for muscle growth like α- and IGF-1.
Satellite Cell Activation
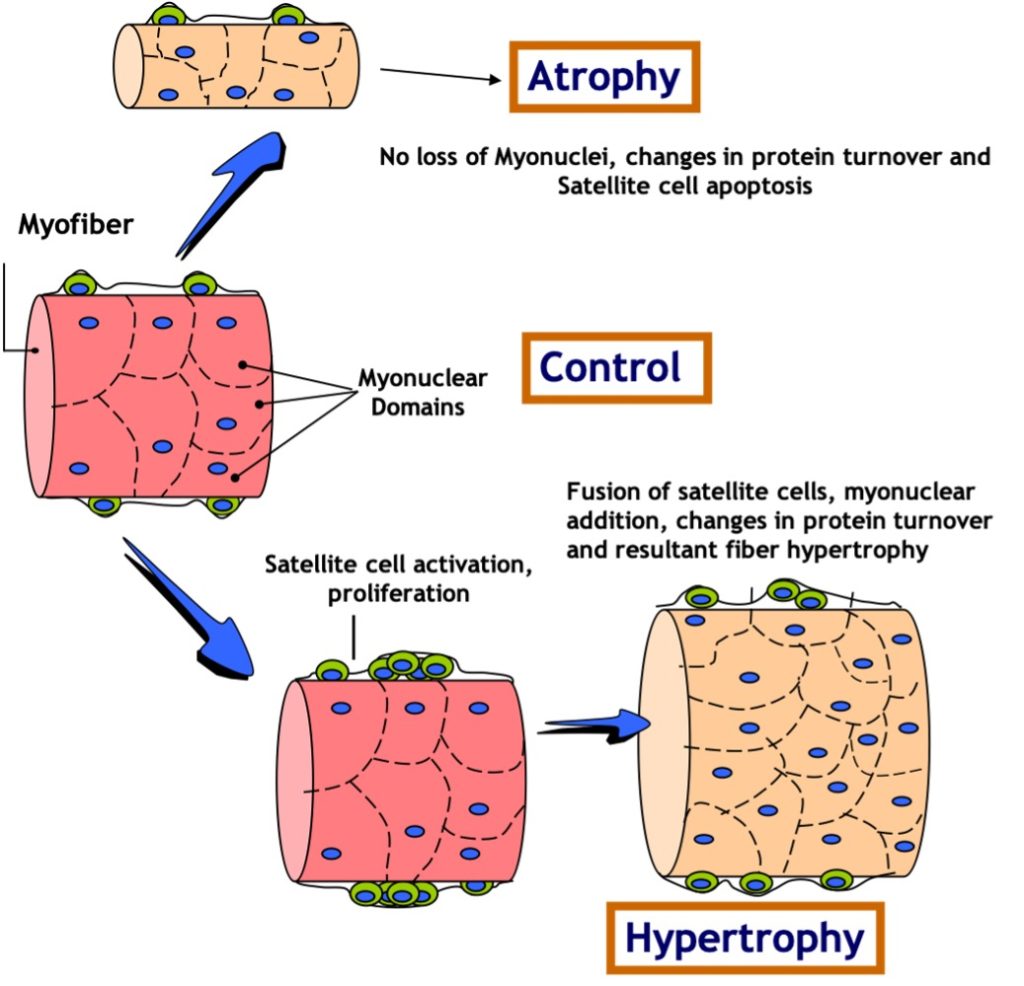
Satellite cells (SC) are normally small dormant cells which reside adjacent to and within the basal lamina but outside of the plasmalemma of the much larger muscle cells (Figure 14.18). When skeletal muscle is exposed to an overload stimulus, factors such as Insulin-like Growth Factor-1 GF-1.are released which act on the neighboring satellite cells, causing them to become activated as well. Once activated, SC can divide to form “daughter” SC or fuse to the mature muscle cell and donate their nuclei and cytoplasm to that much larger muscle cell. Thus, the number of nuclei within a muscle cell can be altered by resistance training. This fusion and donation of nuclei by SC is an important adaptation which leads to muscle cell hypertrophy in response to this form of training. In fact, experiments have shown that if neighboring SC are destroyed prior to the start of training, very little hypertrophy will occur! It stands to reason that if a muscle cell gains a myonucleus and that nucleus continues to be active in gene expression, then the gene products (i.e. proteins) will contribute meaningfully to the size of the cell.
In contrast to muscle growth and hypertrophy of muscle fibres, disuse conditions such as casting, space flight, loss of innervation, or prolonged bed rest produce atrophy of fibres and of the whole muscle. This is likely due to a combination of a decrease in myofibrillar protein synthesis and an increase in protein degradation. In these situations, the number of myonuclei remains constant while the muscle fibre shrinks (Figure 14-18). Maintaining the same number of nuclei in light of a decrease in muscle mass allows for more rapid recovery. This may help explain the phenomenon of muscle “memory”, in which re-adaptations following injury or disuse are more rapid than they were originally when training first began. It should be noted that this is a highly studied area of research, and some controversy still exists in the field.
Research Box: Myonuclear Domain Theory
The myonuclear domain (MND) theory, originally conceptualized by Cheek and colleagues in 1971 (1985), has been widely accepted in research until very recently when it gathered a storm of controversy. Simply put, the theory postulates that each nucleus in a myofibre is responsible for a theoretical amount of cytoplasm and that this nuclear-to-cytoplasmic ratio adapts to changes in muscle size. During muscle hypertrophy, the muscle grows in size either by increasing the cytoplasmic domain size per nucleus or by augmenting the number of myonuclei thereby keeping the MND size constant. Conversely, the theory posits that under conditions ofatrophy as the myonuclei are targeted for destruction, there is an accompanying yet relatively greater loss of cytoplasmic volume and the MND size is reduced.
Much of the work in the field has been conducted by Edgerton and colleagues (1991) who have rigorously studied myonuclear number and domain size during muscle hypertrophy and atrophy Earliest reports suggested an elevation in the number of myonuclei commensurate with an increase in fibre size during muscle hypertrophy wherein the nuclear-to-cytoplasmic ratio remains unchanged. However, it was later illustrated that increases in muscle size can occur independently of changes in nuclei count. In such cases, the domain size has been proposed to increase to a 2000μm threshold ceiling subsequent to which an increase in nuclei number is necessary for further muscle hypertrophy (Allen, 1999). Furthermore, MNDs increase in size during maturational muscle growth and are fibre-type dependent, with the smallest domains found in type I and the largest in type IIB/X fibres. Thus, the literature supports the existence of a constant or increasing size of nuclear domains with muscle hypertrophy.
A multitude of studies have suggested that myonuclei are targeted for degradation and the subsequent loss of MNDs explains the observed muscle atrophy during conditions such as disuse, denervation, neuromuscular disorders and mechanical unloading (Bruusgaard et al., 2012). This notion was recently challenged vigorously by Gundersen and colleagues (Bruusgaard and Gundersen 2008, Gunderson, 2011) who illustrated that these studies had failed to distinguish between the muscle nuclei and nuclei from surrounding cells undergoing apoptosis such as stromal and satellite cells. Using time lapse imaging of a single fibre in vivo, they illustrated no loss of myonuclei despite a 50% reduction in fibre size. Even during aging, a clear pattern has emerged that myonuclei are not lost despite substantial atrophy. In fact, some studies even report an increase in myonuclei per muscle fibre (Petrella, et al., 2006). Clearly, the data are in direct opposition to the MND theory as they reflect that muscle atrophy occurs independently of the loss of myonuclei and is therefore irrespective of the principle of a nuclear-based control over cytoplasmic domains.
Despite the evidence presented by Gundersen et al. (Bruusgaard and Gundersen 2008, Gunderson, 2011) in recent years that challenges the MND theory, it would be premature and unwise to discount the plethora of studies published over the last 30 years that show otherwise. Differences in methodology and study design can account for some of the variability observed. Clearly, this area of research certainly warrants the attention it is currently receiving and may result in a universally agreed upon adjustment to the MND theory and its role in muscle size.
Summary
Muscles are composed of different fibre types which adapt differently depending on the type of exercise imposed. Resistance training typically leads to muscle fibre hypertrophy, thereby increasing strength, while endurance training leads to metabolic adaptations in mitochondrial function, producing greater endurance. The bases for these adaptations reside in exercise-induced modifications of the gene expression pathway, consisting of signaling, gene transcription, mRNA processing, translation, and post-translational modifications and trafficking. A single acute bout of exercise can initiate the adaptation process by activating this pathway. Repeated bouts of exercise (i.e. training) can lead to the accumulation of gene products (i.e. proteins) that result in an alteration in muscle phenotype, and improved function. Understanding how the gene expression pathway works and how exercise can modify it is the basis for our comprehension of exercise adaptations.
References
Adams GR, Hather BM, Baldwin KM, and Dudley GA. 1993. Skeletal Muscle Myosin Heavy Chain Composition and Resistance Training. Journal of Applied Physiology 74(2):911-915.
Allen DL, Roy RR, and Edgerton VR. 1999. Myonuclear domains in muscle adaptation and disease. Muscle & Nerve 22(10):1350-60. doi:10.1002/(SICI)1097-4598(199910)22:10<1350::AID-MUS3>3.0.CO;2-8.
Astorino TA, Allen RP, Roberson DW, Jurancich M, Lewis R, McCarthy K, and Trost E. 2011. Adaptations to high-intensity training are independent of gender. European Journal of Applied Physiology 111(7):1279-86. doi:10.1007/s00421-010-1741-y.
Barton ER. 2006. The ABCs of IGF-I isoforms: impact on muscle hypertrophy and implications for repair. Applied Physiology, Nutrition, and Metabolism 31(6):791-7. doi:10.1139/h06-054.
Baumann H, Jäggi M, Soland F, Howald H, and Schaub MC. 1987. Exercise training induces transitions of myosin isoform subunits within histochemically typed human muscle fibres. Pflügers Archiv : European Journal of Physiology 409(4-5):349-60. doi:10.1007/BF00583788.
Berchtold MW, Brinkmeier H, and Müntener M. 2000. Calcium ion in skeletal muscle: its crucial role for muscle function, plasticity, and disease. Physiological Reviews 80(3):1215-65. doi: 10.1152/physrev.2000.80.3.1215
Biressi S, and Rando TA. 2010. Heterogeneity in the muscle satellite cell population. Seminars in Cell & Developmental Biology 21(8):845-54. doi:10.1016/j.semcdb.2010.09.003.
Bortoluzzi S, Scannapieco P, Cestaro A, Danieli GA, and Schiaffino S. 2006. Computational reconstruction of the human skeletal muscle secretome. Proteins 62(3):776-92. doi:10.1002/prot.20803.
Boström P, Wu J, Jedrychowski MP, Korde A, Ye L, Lo JC, Rasbach KA, Boström EA, Choi JH, Long JZ, Kajimura S, Zingaretti MC, Vind BF, Tu H, Cinti S, Højlund K, Gygi SP, and Spiegelman BM. 2012. A PGC1-α-dependent myokine that drives brown-fat-like of white and thermogenesis. Nature 481(7382):463-8. doi:10.1038/nature10777
Bruusgaard JC, Egner IM, Larsen TK, Dupre-Aucouturier S, Desplanches D, and Gundersen K. 2012. No change in myonuclear number during muscle unloading and reloading. Journal of Applied Physiology 113(2):290-6. doi:10.1152/japplphysiol.00436.2012.
Bruusgaard JC, and Gundersen K. 2008. In vivo time-lapse microscopy reveals no loss of murine myonuclei during weeks of muscle atrophy. The Journal of Clinical Investigation 118(4):1450-7. doi:10.1172/JCI34022.
Bruusgaard JC, Johansen IB, Egner IM, Rana ZA, and Gundersen K. 2010. Myonuclei acquired by overload exercise precede hypertrophy and are not lost on detraining. Proceedings of the National Academy of Science of the United States of America. 107(34):15111-15116. doi:10.1073/pnas.0913935107.
Calvo JA, Daniels TG, Wang X, Paul A, Lin J, Spiegelman BM, Stevenson SC, and Rangwala SM. 2008. Muscle-specific expression of PPARgamma coactivator-1alpha improves exercise performance and increases peak oxygen uptake. Journal of Applied Physiology 104(5):1304-12. doi:10.1152/japplphysiol.01231.2007.
Cheek D. 1985. The control of cell mass and replication. The DNA unit-a personal 20-year study. Early Human Development 12(3):211-239. doi:10.1016/0378-3782(85)90144-6.
Crawford GL, and Horowits R. 2011. Scaffolds and chaperones in assembly: Putting the striations in striated muscle. Biophysical Reviews 3(1):25-32. doi:10.1007/s12551-011-0043-x.
Edgerton VR, and Roy RR. 1991. Regulation of skeletal muscle fiber size, shape and function. Journal of Biomechanics 24 Suppl 1:123-133. doi:10.1016/0021-9290(91)90383-X.
Florini JR, Magri KA, Ewton DZ, James PL, Grindstaff K, and Rotwein PS. 1991. “Spontaneous” differentiation of skeletal myoblasts is dependent upon autocrine secretion of insulin-like growth factor-II. The Journal of Biological Chemistry 266(24):15917-23.
Green HJ, Klug GA, Reichmann H, Seedorf U, Wiehrer W, and Pette D. 1984. Exercise-induced fibre type transitions with regard to myosin, parvalbumin, and sarcoplasmic reticulum in muscles of the rat. Pflügers Archiv : European Journal of Physiology 400(4):432-438. doi:10.1007/BF00587545.
Gundersen K. 2011. Excitation-transcription coupling in skeletal muscle: The molecular pathways of exercise. Biological Reviews of the Cambridge Philosophical Society 86(3):564-600. doi:10.1111/j.1469-185X.2010.00161.x.
Handschin C, Chin S, Li P, Liu F, Maratos-Flier E, LeBrasseur NK, Yan Z, and Spiegelman BM. 2007. Skeletal muscle fiber-type switching, exercise intolerance, and myopathy in PGC-1α muscle-specific knock-out animals. Journal of Biological Chemistry. 282:30014-30021. doi:10.1074/jbc.M704817200.
Hawke TJ, and Garry DJ. 2001. Myogenic satellite cells: physiology to molecular biology. Journal of Applied Physiology (Bethesda, Md. 1985) 91(2):534-51. doi:10.1152/jappl.2001.91.2.534.
Hood D. 2009. Mechanisms of exercise-induced mitochondrial biogensis in skeletal muscle. Applied Physiology, Nutrition, and Metabolism 34(3):465-72. doi:10.1139/H09-049.
Hood DA. 2001. Invited Review: contractile activity-induced mitochondrial biogenesis biogenesis in skeletal muscle. Journal of Applied Physiology (Bethesda, Md. 1985) 90(3):1137-57. doi: 10.1152/jappl.2001.90.3.1137.
Hornberger TA. 2011. Mechanotransduction and the regulation of mTORC1 signaling in skeletal muscle. International Journal of Biochemistry & Cell Biology 43(9):1267-76. doi:10.1016/j.biocel.2011.05.007.
Liu D, Sartor MA, Nader GA, Gutmann L, Treutelaar MK, Pistilli EE, IglayReger HB, Burant CF, Hoffman EP, and Gordon PM. 2010. Skeletal muscle gene expression in response to resistance exercise: Sex specific regulation. BMC Genomics 11:659. doi:10.1186/1471-2164-11-659.
Ljubicic V, Joseph A-M, Saleem A, Uguccioni G, Collu-Marchese M, Lai RYJ, Nguyen LM-D, and Hood DA. 2010. Transcriptional and post-transcriptional regulation of mitochondrial biogenesis in skeletal muscle: Effects of exercise and aging. Biochimica et Biophysica Acta – General Subjects 1800(3):223-34. doi:10.1016/j.bbagen.2009.07.031.
Miller AE, MacDougall JD, Tarnopolsky MA, and Sale DG. 1993. Gender differences in strength and muscle fiber characteristics. European Journal of Applied Physiology and Occupational Physiology 66(3):254-62. doi:10.1007/BF00235103.
Ordway GA, and Garry DJ. 2004. Myoglobin: an essential hemoprotein in striated muscle. Journal of Experimental Biology 207:3441-3446. doi:10.1242/jeb.01172.
Pattengale PK, and Holloszy JO. 1967. Augmentation by a program of skeletal muscle myoglobin of treadmill running. American Journal of Physiology 213(3): 783–785.
Pedersen BK, and Febbraio MA. 2008. Muscle as an Endocrine Organ: Focus on Muscle-Derived Interleukin-6. Physiological Reviews 88(4):1379-406. doi:10.1152/physrev.90100.2007.
Petrella JK, Kim JS, Cross JM, Kosek DJ, and Bamman MM. 2006. Efficacy of myonuclear addition may explain differential myofiber growth among resistance-trained young and older men and women. American Journal of Physiology. Endocrinology and Metabolism 291(5):E937-46 doi:10.1152/ajpendo.00190.2006.
Roepstorff C, Thiele M, Hillig T, Pilegaard H, Richter EA, Wojtaszewski JFP, and Kiens B. 2006. Higher skeletal muscle alpha2AMPK activation and lower energy charge and oxidation in men than in women during submaximal exercise. Journal of Physiology 574(Pt 1):125-38. doi:10.1113/jphysiol.2006.108720.
Rusko HK. 1992. Development of aerobic in relation to age and training in cross-country skiers. Medicine and Science in Sports and Exercise 24(9):1040-7.
Sandri M. 2008. Signaling in Muscle Atrophy and Hypertrophy. Physiology 23:160-170. doi:10.1152/physiol.00041.2007.
Scarpulla RC. 2011. Metabolic control of mitochondrial biogenesis biogenesis through the PGC-1 family regulatory network. Biochimica et Biophysica Acta 1813(7):1269-78 doi:10.1016/j.bbamcr.2010.09.019.
Short KR, Vittone JL, Bigelow ML, Proctor DN, Coenen-Schimke JM, Rys P, and Nair KS. 2005. Changes in myosin heavy chain mRNA and protein expression in human skeletal muscle with age and endurance exercise training. Journal of Applied Physiology 99:95-102. doi:10.1152/japplphysiol.00129.2005.
Steensberg A, Keller C, Starkie RL, Osada T, Febbraio MA, and Pedersen BK. 2002. IL-6 and TNF-alpha express1`ion in, and release from, contracting human skeletal muscle. American Journal of Physiology. Endocrinology and Metabolism 283(6):E1272-8. doi:10.1152/ajpendo.00255.2002.
Van der Meer SFT, Jaspers RT, and Degens H. 2011. Is the myonuclear domain size fixed? Journal of Musculoskeletal & Neuronal Interactions 11(4):286-97.
Williamson DL, Godard MP, Porter DA, Costill DL, and Trappe SW. 2000. Progressive resistance training training reduces myosin heavy chain coexpression in single muscle fibers from older men. Journal of Applied Physiology (Bethesda, Md. : 1985) 88(2):627-33. doi:10.1152/jappl.2000.88.2.627.
West DWD, Burd NA, Churchward-Venne TA, Camera DM, Mitchell CJ, Baker SK, Hawley JA, Coffey VG, and Phillips SM. 2012. Sex-based comparisons of myofibrillar protein synthesis after resistance exercise in the fed state. Journal of Applied Physiology 112(11):1805-13. doi:10.1152/japplphysiol.00170.2012.
Wüst RCI, Morse CI, De Haan A, Jones DA, and Degens H. 2008. Sex differences in contractile properties and resistance of human skeletal muscle. Experimental Physiology 93(7):843-50. doi:10.1113/expphysiol.2007.041764.
Examine your adaptations to endurance training
Resources to have available:
- Exercise facility with a calibrated bicycle ergometer or treadmill;
- Portable blood lactate analyzer;
- Heart rate monitor;
- A partner to help with heart rate (HR) or breathing rate (f).
Purpose: to examine your individualized adaptations to endurance training
Methods:
- Design your own endurance training regimen in which you exercise using a modality of your choice (e.g. Jogging, swimming, cycling) 3-4 times/week, at 60-90% of your maximum HR for at least 6 weeks. This program needs to be in addition to your current level of activity. Prior to starting this additional training, test your current fitness level using an indirect, submaximal fitness test (e.g. Astrand-Rhyming test). At a standardized, absolute workload, measure your HR and breathing frequency (f; here is where a partner could help). If possible, donate a finger prick blood drop for lactate analysis.
- Complete the fitness training program.
- Repeat your measurements again after 6 weeks of training, using the same test workload as in the pre-test.
Expected Results:
- A lower HR and f are expected at the same absolute workload after training.
- Reduced blood lactate concentrations are also expected, reflecting less lactic acid production by the working muscle. This is probably a result of an improved mitochondrial content (and therefore aerobic system energy provision) as an adaptation to training. This adaptation means that there is less reliance on anaerobic glycolysis for synthesis post-training, and greater endurance.
Introducing the Authors

D.A. Hood, , , , , School of Kinesiology and Health Science, Muscle Health Research Centre, York University, Toronto ON. David A. Hood is a Full Professor and Tier I Canada Research Chair in Cell Physiology in the School of Kinesiology and Health Science at York University. His research investigates the role of exercise and disuse on mitochondrial turnover in skeletal muscle.
N. Cheema, Harvard Medical School and Massachusetts General Hospital.

Nashwa Cheema is a postdoc in Dr. Rox Anderson’s lab in Harvard Medical School at Massachusetts General Hospital (HMS/MGH) and has been working on a project to enhance muscle performance and mitigate injuries with the application of photobiomodulation, the process of near-infrared light treatment. She obtained her PhD in 2017 at University of Alberta, Canada, in Physiology, Cell and Developmental Biology where her thesis was focused on sarcopenia, loss of muscle mass and function, in aged rats. Prior to joining HMS/MGH in 2020, Nashwa was a postdoc in Dr. David Hood’s laboratory at York University, Canada, a pioneer in the field of exercise physiology. Her project in his lab was focused on treatment strategies for mitochondrial health in isolated fibroblasts from patients with mitochondrial mutations.
Ayesha Saleem, Faculty of Kinesiology and Recreation Management, University of Manitoba, Children’s Hospital Research Institute of Manitoba (CHRIM), Manitoba

Heather Carter –

Heather Carter received her PhD degree (2017) from the School of Kinesiology and Health Science at York University
She is now enrolled as a student at OISE, University of Toronto
Anna Vainshtein –Director, Craft Science Inc.

Dr. Anna Vainshtein is currently the director of Craft Science Inc., a science communications consulting firm based out of Toronto, Canada. She earned her B.Sc. (Hons), MSc. and Ph.D. at the School of Kinesiology and Health Science at York University, Toronto, Canada. During her academic journey, Dr. Vainshtein discovered and cultivated a profound passion for mitochondria, autophagy, muscle biology, and cellular bioenergetics. Seeking to deepen her understanding of mitophagy’s intricate roles in skeletal muscle, she pursued a fellowship at the Venetian Institute for Molecular Medicine in Padova, Italy. Subsequently, she completed her postdoctoral training at the Department of Molecular and Human Genetics at Baylor College of Medicine in Houston, Texas, USA, where she expanded her expertise to encompass the genetic regulation of the autophagy-lysosome system. Dr. Vainshtein’s journey reflects a relentless pursuit of knowledge and a commitment to advancing the frontiers of biomedical science on an international stage.
Olga Ostojic

Olga Green (née Ostojic) completed both a Bachelor’s (2010) and Master’s (2012) degree from the school of Kinesiology and Health Sciences at York University. She then went on to complete her Doctor of Dental Surgery degree at the University of Toronto. She partook in several dental outreach initiatives, including a rotation within a hospital-based clinic in Moose Factory, Ontario, where she worked with underserved First Nations populations. She now works as a general dentist in Toronto.
S. Iqbal

Sobia Iqbal – received her PhD degree (2015) from the School of Kinesiology and Health Science at York University
She is now a part-time faculty at Wilfrid Laurier University – Waterloo in the department of Biology
