
Chapter 13: Potentiation and Fatigue, the Consequences of Repetitive Activation of Muscle
Brian R. MacIntosh and S. Jayne Garland

Learning Objectives
After studying this chapter, you should be able to:
- Describe the various forms of activity dependent potentiation
- Discuss the mechanisms of activity dependent potentiation
- Identify the difference between central and peripheral fatigue
- Discuss the potential causes and mechanisms of central and peripheral fatigue
- Illustrate changes in Ca2+ sensitivity and discuss the possible mechanisms
- Describe the metabolic changes in fatigued muscle
- Describe the changes in contractile properties associated with muscle fatigue
Key Terms:
activity dependent potentiation, calcium sensitivity, calmodulin, fatigue, central fatigue, peripheral fatigue, history dependence, myosin light chain kinase, postactivation potentiation, posttetanic potentiation, staircase potentiation, time-trial, twitch, postactivation performance enhancement
Introduction
Skeletal muscle has several properties that are considered history dependent properties. This means that muscle “remembers” that it has been active, or in some cases that length has changed, and this memory has very specific consequences with respect to the subsequent contractile response. This history dependence can be divided into three characteristic features: 1) potentiated (enhanced) contractile response due to recent contractile activity; 2) attenuated contractile response due to recent contractile activity and 3) enhancement or diminishment of isometric force by stretch or shortening respectively. The last of these will not be presented in this textbook. In the case of potentiation and fatigue, the magnitude of contraction for a given stimulation depends on the influence of these two processes, and the contribution of these depends on how much contractile activity has occurred in the recent past and how long ago that contractile activity occurred.
Case Presentation: Does Warm-up Cause Neuromuscular Fatigue?
For the case presentation in this chapter, we will present the results for one subject in a study that was recently published in Journal of Applied Physiology (Tomaras and MacIntosh 2011). The name of the subject cannot be revealed due to confidentiality requirements, but we will assume this subject was “Andrew” (see Character Profiles). The study was conducted to determine whether or not the usual warm-up procedures followed by sprint cyclists in preparation for a flying 200 m time-trial are appropriate.
It was surprising to find out that sprint cyclists warm-up for 45 min prior to this sprint event, which takes about 10 s to complete. Their traditional warm-up typically consists of an aerobic component that involves progressive increase in exercise intensity over 30 min from 60 % of maximal heart rate to 95 % of maximal heart rate. This is followed by a series of 3-4 sprints, each of which lasts only 8 s. Each sprint is followed by a recovery ride for 1.5 min at low intensity and 6.5 min rest. In contrast with this warm-up, an alternative warm-up was designed by the study authors. The alternative warm-up was intended to prepare the cyclist for a competitive event, without overdoing it. This alternative warm-up, referred to here as the experimental warm-up involved 15.5 min of aerobic cycling, while increasing exercise intensity to 70 % of maximal heart rate and this was followed by just one 8 s sprint.
Andrew was asked to come to the lab on four separate occasions, but here we will describe the first two lab visits, and we will focus on the muscle contractile measurements that were made. On each of the two visits, Andrew had twitch contraction measurements made prior to and after doing one of the two warm-ups completed in random order. A twitch is the contractile response to a single activation. In this case the single activation was applied to all motor units of his quadriceps muscles. Figure 13-1 shows the results of the twitch measurements for Andrew on each of these two visits.

Following each warm-up, the twitch contractions undergo some dramatic changes, demonstrating postactivation potentiation and fatigue. The amplitude of the twitch at 1 min after the traditional warm-up was clearly less than 1.0. For the next two min, the twitch amplitude decreases, indicating that although fatigue was present, postactivation potentiation was also present, and this potentiation dissipates, revealing additional fatigue. The contraction was greater than 1.0 after the experimental warm-up, and decreased in amplitude over the next few minutes, illustrating the dissipation of this potentiation. Fatigue is not apparent in Andrew’s quadriceps muscles after the experimental warm-up. The twitch amplitude does not decrease below 1.0.
According to these results, Andrew would have an advantage if he did the experimental warm-up, but would be fatigued if he did the traditional warm-up. The performance results on the next two visits confirmed this advantage, as his power output on a cycle ergometer was higher when he did the experimental warm-up than when he did the traditional warm-up. His results were typical of the subjects in this study. The research confirmed that fatigue results from the traditional warm-up and higher power output was achieved after the experimental warm-up.
Activity Dependent Potentiation:
Prior contractile activity results in enhanced contractile response which can only be adequately quantified with controlled activation. The most consistent way to detect this enhanced contraction is with electrical stimulation (MacIntosh et al. 2012c). This enhanced contractile response is referred to as activity dependent potentiation.
There are three forms of activity dependent potentiation: staircase potentiation, posttetanic potentiation and postactivation potentiation. The mechanism for activity dependent potentiation is common between these forms of potentiation. This mechanism is primarily dependent on regulatory light chain phosphorylation, as described below. Before we get to this mechanism, the contractile response associated with each of these forms of potentiation will be described.
Staircase
Repeated stimulation of muscle at a low frequency, resulting in discreet twitch contractions or intermittent submaximal (incompletely fused) tetanic contractions, will result in a progressive increase in amplitude of these contractions (Figure 13-2), at least for the first few seconds. Staircase potentiation was first observed in isolated animal muscle, but the first report in human muscle was by Brown and Tuttle (1926). Staircase and is typically observed in research studies (Close 1967; Krarup 1981; MacIntosh and Gardiner 1987; Rassier and MacIntosh 2000).
The shape of the twitch contraction gives some clues to the cellular mechanism associated with staircase. The twitch increases in amplitude, but contraction time is not longer (see Figure 13-3). This observation relates to the mechanism. The ways in which a twitch contraction can be affected in amplitude are illustrated in Figure 13-4. It can be seen here that an increase in amplitude of the twitch is dependent on the rate of rise of force and/or the duration of the rise in force. In the case of activity dependent potentiation, it is the rate of rise of force that determines the magnitude of the twitch contraction. This implies that potentiation is a property of intensity of activation, not duration.


On the left, the first twitch in the sequence showing staircase is the smaller of the two contractions. You can see that staircase has resulted in a much larger twitch contraction, and that the contraction time (time from start of the twitch to the peak force) is minimally affected, but relaxation is accelerated. These differences are more obvious when the amplitudes of the two contractions are normalized to the same amplitude as shown on the right.

The progressive rise in force associated with staircase continues for several seconds. With consecutive contractions, active force reaches a peak, then begins to decrease as stimulation continues. This decrease clearly relates to fatigue, and the question that comes to mind with this change is “when did the fatigue begin”? Considering that when active force first begins to decline, the force is still above the initial contraction, so potentiation and fatigue coexist. It is possible that factors causing fatigue were present much earlier than the time when force first begins to decline. This issue of coexistence of fatigue and potentiation has been addressed in several publications dealing with activity dependent potentiation (Fowles and Green 2003; Green and Jones 1989; MacIntosh and Bryan 2002; Rankin et al. 1988; Rassier and MacIntosh 2000), and will be addressed further after fatigue is presented, later in the chapter.
Posttetanic Potentiation
A twitch or submaximal tetanic contraction will be enhanced following a tetanic contraction, relative to what it was prior to that tetanic contraction (see Figure 13-5). In these circumstances, the tetanic contraction that has caused potentiation is referred to as a conditioning contraction; that is, the tetanic contraction affects the contractile response of subsequent contractions, or it has altered the conditions under which subsequent contractions occur. When the following contraction is a twitch, similar to staircase, the twitch is increased in amplitude, but the time-course of the twitch is not prolonged. This implies that the mechanism of potentiation is associated with an intensification of the activation, not a prolongation of activation. The magnitude of enhancement varies with the duration of tetanic contraction, and is also dependent on the frequency of activation within the tetanic contraction. O’Leary and colleagues (O’Leary et al. 1997) reported nearly 50% increase in twitch contraction amplitude after 7 s tetanic stimulation at 100 Hz; in human subjects.

Postactivation Potentiation:
When the conditioning contraction is a voluntary contraction, the subsequent enhanced contractile response is called postactivation potentiation (PAP). Typically, PAP has been measured as an enhanced twitch following a maximal voluntary contraction (Baudry and Duchateau 2007). However, PAP can occur following submaximal contractions (MacIntosh 2012). PAP can only be confirmed with electrical stimulation, to be sure the motor unit involvement is the same. There has been a recent glut of papers in the past 10 years that have used the term PAP without confirming that there was an enhanced contractile response for a given stimulation. For this reason, the term “postactivation performance enhancement” has been introduced (Cuenca-Fernández et al. 2017). This novel aspect of potentiation will be discussed below.
It is interesting to consider how PAP affects neural control of contraction. If the twitch is enhanced as a result of PAP, and submaximal tetanic contractions are also enhanced, then as PAP develops, the frequency of activation needed to achieve a given amplitude of contraction will change. This has been examined in a series of papers by Klein and colleagues. Young healthy subjects performed a 30% MVC isometric contraction before and after a 75% MVC conditioning contraction. The postactivation potentiation induced by the conditioning contraction was associated with a significant reduction in motor unit firing rate (Klein et al. 2001). When the same experiment was performed in older adults, the conditioning contraction resulted in a comparable amount of PAP but only a modest reduction of motor unit firing rate that was no longer correlated with the amount of PAP (Klein et al. 2002). We do not know what signal the central nervous system uses to modify the firing rate of a given motor unit to elicit the desired force when the force response obtained is changing so drastically. Researchers have altered the duration of the twitch contraction by either cooling the muscle or changing the muscle length which should change the force-frequency relationship. However, the motor unit discharge rate needed to duplicate the force of a control contraction did not necessarily change in concert with the changing contractile speed. Although not experimentally-proven, the central nervous system receives feedback on the amount of tension produced by the muscle and this feedback could be used to reduce the drive sent to the motoneuron pool in situations where constant force is required. Whatever the signal is, it would appear to be negatively affected by age.
Now that we know what the various forms of activity dependent potentiation are, it is time to consider the mechanism of this history dependent property of muscle. Several possible mechanisms have been proposed over the years, but at the current time, only one mechanism is considered to be responsible for activity dependent potentiation. This mechanism relates to myosin regulatory light chain (RLC) phosphorylation, as described below. A second possible mechanism is also presented below.
The Mechanism of Activity Dependent Potentiation
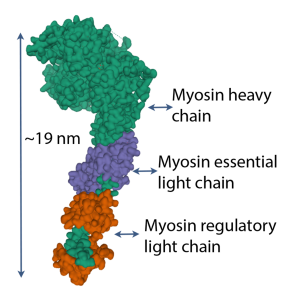
Protein phosphorylation is one of the main forms of posttranslational modification of proteins. The addition of a phosphate group to a protein often activates it or modifies the tertiary structure of the molecule, changing its function in the process. Each myosin head contains a pair of light chains, one of which is phosphorylatable. This phosphorylatable light chain is called the RLC, because phosphorylation permits the RLC to alter the function of the myosin head. Figure 13-6 shows the location of the RLC on the myosin head.
Phosphorylation and Dephosphorylation of Regulatory Light Chains
Before we consider how phosphorylation alters the myosin head function, we will discuss how the RLC gets phosphorylated. Phosphorylation is achieved by the enzyme, myosin light chain kinase (MLCK), which is inactive when the muscle is in a resting state.
When a muscle has been inactive for 6 min or longer, the light chains of myosin are minimally phosphorylated (about 10%). In this state, the contractile response is not potentiated. However, any muscle contraction will result in activation of the MLCK and this will result in an increase in light chain phosphorylation.

As you are aware, activation of muscle results in a rise in intracellular [Ca2+]. Calmodulin is a Ca2+-binding protein that functions in the activation of a number of proteins. One of these proteins that is activated by calmodulin is MLCK. When [Ca2+] rises, Ca2+ binds to calmodulin and the Ca2+ – calmodulin complex binds to MLCK, activating it. The activity of MLCK depends on the [Ca2+], so during contractions that are obtained with relatively high frequency of activation and therefore high [Ca2+], the activity of MLCK will be high. This scheme of activation of MLCK is illustrated in Figure 13-7. This figure also illustrates the consequences of this phosphorylation.
![This graph plots relative force (varying between 0 and 1.0 against pCa2+, the negative log of [Ca2+], ranging from 8 on the left to 4 on the right. Three lines rise from the baseline to the peak with a sigmoidal shape. The control line is in the middle. A dashed blue line represents increased Ca2+ sensitivity and is shifted slightly to the left. A dotted green line represents decreased Ca2+ sensitivity and is shifted slightly to the right.](https://pressbooks.openeducationalberta.ca/app/uploads/sites/228/2023/01/Picture13-8.jpg "By Brian R. MacIntosh")
Factors Affecting Activity Dependent Potentiation
The magnitude of potentiation obtained following a conditioning contraction is dependent on several factors, including: the magnitude of RLC phosphorylation, sarcomere length, temperature, test stimulus frequency, and fatigue. The interaction of these factors is presented in a review (MacIntosh 2003), but here we will briefly describe how these factors affect the magnitude of potentiation, and introduce how they interact. The nature of the conditioning contraction affects the potentiation by two mechanisms: it determines the level of activation of MLCK and the conditioning contraction can result in fatigue, a regulatory process that opposes potentiation (MacIntosh et al. 2012b) when energy resources in the cell are limited (see later in this chapter).
Magnitude of Light Chain Phosphorylation
The magnitude of RLC phosphorylation is dependent on the activities of two enzymes: MLCK and light chain phosphatase. As indicated above, MLCK is activated by increased [Ca2+]. Light chain phosphatase is apparently unregulated, and has a low but continuous level of activity.
At rest, about 10 % of the light chains are phosphorylated. With each muscle activation, the enzyme MLCK is activated. When the interval between activations is short, the level of enzyme activation will accumulate, decreasing only slightly between contractions. It takes a few seconds for MLCK activity to decrease to the resting level. When MLCK activity is above the resting level, there will be an accumulation of phosphorylation of the RLC. When the MLCK activity is low, the light chain phosphatase activity will predominate, and the level of RLC phosphorylation will decline exponentially over time, to the resting level.
The magnitude of potentiation observed at a given level of phosphorylation is dependent on a number of factors. Most of these are described below. One such factor that is not presented below is the impact of [Ca2+]. Take another look at Figure 13-8. At low [Ca2+], the relative increase in force is large for a given increase in Ca2+ sensitivity. At high [Ca2+] the relative increase in force is much less.
This consideration assumes that [Ca2+] remains constant from one contraction to the next. A change in [Ca2+] can contribute to potentiation or diminish its effect. It was shown recently that in a series of submaximal contractions, [Ca2+] does not remain constant (Glass et al. 2021). In fact, the second and third contractions have increased [Ca2+], and this increase will contribute to potentiation. This aspect of the mechanism of activity dependent potentiation has been given very little consideration.
Fibre Type:
You will recall from Chapter 4 that human skeletal muscle has three primary fibre types and rat skeletal muscle has four. The primary determinant of fibre-type is the ATP isoform. Hybrid fibres with more than one ATP isoform do exist, meaning that not all fibres can be classified into the discreet fibre types. The myosin isoform composition of muscle can affect activity dependent potentiation in at least two ways.
In general, it can be said that a higher level of light chain phosphorylation is achieved in fast-twitch fibres than in slow-twitch fibres. This occurs as a result of differences in MLCK activity and differences in phosphatase activity. Fast-twitch fibres have higher MLCK activity, and lower phosphatase activity than slow-twitch fibres. For this reason, a given stimulation will result in a higher rate of regulatory light chain phosphorylation in fast-twitch fibres than in slow-twitch fibres. When stimulation has stopped, the rate of dephosphorylation will be slower in the fast-twitch fibres (Grange et al. 1993).
The second factor that affects fibre type difference for activity dependent potentiation is fatigue. Slow-twitch fibres tend to be more fatigue resistant than fast-twitch fibres. Any conditioning contraction will cause some fatigue and some potentiation. The resulting contractile response after the conditioning contraction will reflect the balance of fatigue and potentiation. In spite of the lower amount of fatigue, slow-twitch fibres still have less activity dependent potentiation than fast-twitch fibres. However, it has been observed that endurance trained individuals demonstrate more twitch potentiation than control subjects or resistance trained individuals (Hamada et al. 2000). This reported difference does not consider actual fibre type differences between these groups of individuals, and the reported difference in potentiation could be dependent on less fatigue in the fast-twitch type IIa fibres.
Sarcomere Length
It has been known for some time now that the magnitude of potentiation obtained from a given conditioning stimulation is greater at short muscle length than at long length. In fact, it has been shown that even when twitch potentiation is evident at short sarcomere lengths, the same conditioning contraction will cause fatigue when measured by twitch contraction at long sarcomere lengths (Rassier and MacIntosh 2002). Rassier et al. (1997) showed that the length dependence of potentiation was not due to differences in magnitude of RLC phosphorylation, so greater potentiation was evident at short sarcomere lengths than at long sarcomere lengths, for a given level of light chain phosphorylation.
The proximity of the myosin head to actin is also affected by sarcomere length. At long sarcomere lengths the filaments are closer together. The distance between the filaments is affected by the diameter of the fibre, and as the fibre is stretched, the diameter becomes smaller. This occurs because the volume of the fibre remains constant.
The proximity of the filaments, as sarcomere length increases, also increases the probability of myosin head interaction with actin, and increases Ca2+ sensitivity (Stephenson and Williams 1982). Obviously, light chain phosphorylation and long sarcomere length have similar effects. The two mechanisms are not additive when one of these mechanisms has optimally potentiated the muscle, the other mechanism can no longer enhance the contraction. For this reason, the magnitude of potentiation with a given level of light chain phosphorylation is greater at short sarcomere length, and much less at long sarcomere lengths where increased mobility of the myosin heads has less effect on probability of actin myosin interaction.
Temperature
The temperature of the muscle can affect the magnitude of potentiation for a given level of RLC phosphorylation. At room temperature, relatively little potentiation is observed when RLC phosphorylation increases from resting level to 50-60 % . However, the same increase in phosphorylation will result in considerably more potentiation at 37C, normal human body temperature. At colder temperatures, the magnitude of potentiation decreases even more (Gossen et al. 2001).
The mechanism for the temperature dependence of activity dependent potentiation is unknown, but MacIntosh has proposed a theory (MacIntosh 2003). It has been reported that the mobility of the myosin heads increases at cold temperatures (Xu et al. 2003), similar to the increased mobility observed with regulatory light chain phosphorylation. The absence of potentiation at low temperatures when the light chains are phosphorylated can be explained by the fact that Ca2+ sensitivity is already increased by this temperature dependent enhanced mobility, and cannot be increased further. The myosin heads are already more mobile, so light chain phosphorylation does not increase mobility and has no effect on Ca2+ sensitivity.
Test-stimulus Frequency and Duration
Historically, the presence of potentiation and measurement of its magnitude has been done using single pulse stimulation. Twitch contractions are the most sensitive way to evaluate potentiation, particularly when tested at a short sarcomere length. However, it is of interest to know the impact of activity dependent potentiation on contractions that are obtained with low frequency activation (stimulated or voluntary). This range of frequencies would have the most relevance for voluntary activation.
Warm-up Effects of Postactivation Potentiation
It has been suggested that postactivation potentiation can enhance brief maximal effort contractions (Sale 2002). This suggestion is based on the fact that PAP increases the peak rate of force development, so early in a maximal effort contraction, the force will rise faster. When the contraction is so brief that maximal voluntary force cannot be reached, the potentiated contraction will be of greater magnitude than the nonpotentiated contraction. This is illustrated in Figure 13-9, where it can be seen that force rises faster in the potentiated state, so when the contraction is very brief, a greater active force is obtained than before the conditioning contraction (nonpotentiated state). The suggestion that maximal effort performance should be enhanced by a prior conditioning contraction set off a series of research studies to test this idea. This notion is like taking a practice golf swing, then stepping up to address the ball. Keep in mind that potentiation might increase the possible force of the swing, but other factors, like coordination will dictate the direction the ball goes.

In spite of considerable interest in this concept of PAP assisted performance, it has been difficult to prove that PAP can contribute to the warm-up in a way that enhances subsequent performance. Early attempts to demonstrate this aspect of warm-up were successful at demonstrating the importance of fatigue in impairing subsequent response (Gossen and Sale 2000). This is consistent with work described in the case study (see beginning of chapter) that has confirmed that some athletes do too much warm-up (Tomaras and MacIntosh 2011). However, in spite of a large number of attempts, it has not been clearly demonstrated that high intensity conditioning contractions as part of the warm-up can enhance subsequent high intensity performance by PAP. The difficulty is that even when performance enhancement is observed, it has not been possible to confirm that PAP is the determining factor. In fact performance enhancement after a conditioning contraction appears to follow a different time-course than PAP. For this reason, the term “postactivation performance enhancement” (PAPE) has been introduced (Cuenca-Fernández et al. 2017). This is a more general term that can be used for any mechanism that enhances performance following one or more high intensity conditioning contraction(s).
Several studies have investigated what they call PAP, but have not confirmed the presence of PAP. These studies have typically investigated the impact of a high intensity warm-up on subsequent performance, and several such studies have confirmed that the high intensity effort during the warm-up is associated with improved performance. In many cases the performance was evaluated at a time when it would not be expected that PAP was present. Typically, performance assessment is made 8 min or longer after the conditioning contraction. However, this research does not rule out some other factor, like temperature actually causing the improved performance. Regardless of whether or not PAP does allow enhanced maximal effort performance, it would only make a difference within the first few contractions of a performance. Eventually, the effort itself will result in PAP, then fatigue. The ideal situation would be if you could induce PAP by a conditioning contraction that resulted in very little fatigue. Then the first few maximal effort contractions would be enhanced by the increased maximal rate of force development.
As mentioned above, PAP can coexist with fatigue. This can occur because the mechanisms that cause fatigue can coexist with or counter the mechanisms that cause PAP (Rassier and MacIntosh 2000). Now we will turn our attention to fatigue; what is it and what are the mechanisms?
Skeletal Muscle Fatigue
Definition of Muscle Fatigue:
The term “muscle fatigue” is used in a broad range of contexts. For this reason, it is a term that often needs to be interpreted from the context of its use (see discussion of definitions in Chapter 1). Fatigue can be used in a general sense to refer to a state of mental tiredness. Fatigue is also used to refer to solid structures that are failing due to use. However, in this chapter we will use the term “fatigue” to refer to a short-term depression of contractile response that is attributable to prior exercise.
Traditionally, fatigue has been defined as an exercise-induced reduction in the ability of muscle to produce force or power whether or not the task can be sustained (Bigland-Ritchie and Woods 1984; Søgaard et al. 2006). When performing maximal voluntary contractions, it is pretty easy to observe the failure of force production. However, there are relatively few activities, even in competitive sport, that require the maintenance of maximal force or power for any length of time. Instead, most of our activities require the maintenance of submaximal force or power, intermittently over time. Although someone may be able to maintain the target force or power, it doesn’t mean that they are not becoming fatigued. In the same way, just because maximal isometric force is not depressed does not mean fatigue is absent.
A valuable way to evaluate fatigue is to stimulate all motor units of a muscle with a known frequency of activation. This can be as simple as a single pulse, or a series of activations with a range of frequencies. This approach has been particularly valuable in detecting low-frequency fatigue. When fatigue is defined as a reduction in maximal force, low-frequency fatigue is not detected. Typically, to accurately quantify fatigue, stimulation is applied to the motor neurons, and the muscle force is measured. Alternatively, the stimulation could be applied directly to the muscle of interest. In both of these cases, the detection of fatigue relies on what is going on in the periphery. The central nervous system is bypassed. This approach to detection of fatigue can only detect peripheral fatigue (see below). Furthermore, this approach requires special equipment (stimulator and force measuring device) that is not universally available.
Low-Frequency Fatigue
It is important to remember that muscle fatigue can exist, even when maximal force is not decreased! When the force depression following exercise persists only at lower frequency of stimulation and maximal force has recovered, it is called low-frequency fatigue. This is illustrated in Figure 13-10. Low-frequency fatigue is typical of postexercise fatigue and can persist for more than 24 hours (Edwards et al. 1977).

Low-frequency fatigue is detected by stimulating the muscle at low and high frequencies in order to determine if the depression of force is greater at the lower frequency. Alternatively, the low frequency response can be compared with a maximal voluntary contraction which is assumed to represent a high-frequency response. There are many publications that describe low-frequency fatigue as the consequence of repetitive low-frequency stimulation, but this is not the true definition of low-frequency fatigue. The frequency of activation during the exercise is not relevant to the development or observation of low-frequency fatigue.
Low-frequency fatigue is very relevant to those who engage in vigorous intensity exercise on a regular basis. Recovery from low-frequency fatigue is very slow, so subsequent exercise performance can be compromised, even 24 hours later. Most training programs consider this and never put two hard workouts on successive days. Low-frequency fatigue is a common consequence of a bout of lengthening contractions (Keeton and Binder-Macleod 2006).
Mechanisms of Fatigue
In order to address the mechanisms of fatigue, the pathway for motor command must be considered. This pathway is illustrated in Figure 13-11. Here, it can be seen that to exercise, or maintain a constant force or power output, one must engage the neural pathway from motor cortex to spinal motor neurons. The final structure in this pathway is the skeletal muscles. Fatigue could be a consequence of failure at any point along this motor command pathway. This pathway can be divided into two areas: central and peripheral; representing the central nervous system and the peripheral nervous system and muscles.

Peripheral fatigue is potentially due to one of the following: a lower [Ca2+] achieved during activation, decreased Ca2+ sensitivity or less force per cross-bridge. There is considerable evidence for all of these mechanisms, but the actual cause of the decreased [Ca2+] or decreased Ca2+ sensitivity is not as clear.
Does Fatigue Represent Regulation of Activation?
It has been suggested that fatigue, a decreased contractile response for a given stimulation, is a regulatory process designed to prevent depletion of ATP (MacIntosh et al. 2012b). This explanation of fatigue seems very logical and evidence is obvious. The first line of evidence relates to the fact that ATP concentration is strongly defended, typically falling to 60-70% of the resting value only after exhaustive exercise (Harmer et al. 2000). This is important, because the ratio of the concentrations of ATP and ADP give the energy charge for processes using the energy from ATP. When [ATP] decreases or [ADP] increases, the energy available for cellular processes decreases. There are several ways that decreasing [ATP] can affect excitation of the myocyte: depolarize the membrane with inhibition of the Cl– and K+ channels, and impair Ca2+ release by the ryanodine receptor. It has also been suggested that glycogen depletion might regulate Ca2+ release, contributing to a regulated fatigue process (Ørtenblad et al. 2011).
Central Fatigue:
Central fatigue is evaluated through the estimation of voluntary activation. The most common technique, because of its simplicity, low cost, and low risk, is called the interpolated twitch technique. This was first developed by Merton (1954) and popularized by Belanger and McComas in the early 80s (1981; 1989). There has been a commentary in the Journal of Applied Physiology debating the accuracy of the technique (de Haan et al. 2009; Taylor 2009). The technique involves superimposing a supramaximal electrical stimulus to the peripheral nerve innervating the contracting muscle group. The premise is that if the voluntary contraction is truly maximal, then the addition of an electrical stimulus ought to evoke no more force than that already being produced. If anything, the additional stimulus results in a period of electrical silence in the muscle and a corresponding drop in force. On the other hand, if the voluntary contraction is not maximal, the increase in frequency of firing of active motor units or the recruitment of additional motor units will produce a brief increment in the force production. This interpolated twitch has been quantified, by dividing the incremental force by the peak force of a potentiated twitch evoked at rest immediately after the MVC. Equation 1 presents the method of calculating voluntary activation ratio (VAR) and Figure 13-12 illustrates this technique.
VAR = 1 – (Twi/Twp) Equation 1
Where VAR is voluntary activation ratio, Twi is interpolated twitch amplitude and Twp is potentiated twitch amplitude.

It is recommended to use the potentiated twitch because the voluntary contraction will cause activity dependent potentiation so the interpolated twitch will likely be potentiated. The use of a nonpotentiated twitch in the equation would result in underestimation of the VAR. On the other hand, if the interpolated twitch results primarily from recruitment of inactive motor units, these should not be potentiated.If the voluntary contraction is close to maximal, it can be quite difficult to detect the small increment in the force production when the extra stimulus is applied. There are different ways to try and improve this detection. One method is to superimpose a doublet (two pulses with a short inter-impulse interval – less than 10 ms) instead of a single stimulus. This creates a bigger force, and hence improves the resolution of the force difference when superimposed on the voluntary force. To make the proper calculation, the potentiated twitch must also be obtained with doublet stimulation.
It has been reported that true maximal force is more easily achieved in some muscles than others (Shield, 2004 #18056). However, in a noninjured limb that is free of pain, most individuals are capable of near maximal activation. This allows the use of this technique to detect central fatigue. If voluntary activation, as calculated using equation 1, decreases as a result of physical effort, then central fatigue is present.
Mechanism of Central Fatigue
We have just dealt with one easy way to measure central fatigue. The causes of central fatigue can be placed in three categories: (A) insufficient descending drive to the motoneuron from central sources; (B) inhibition of the motoneuron at the spinal level; (C) changes to the motoneuron intrinsic properties that make it difficult for the motoneuron to be repetitively active (see below).
The interpolated twitch technique cannot differentiate between central fatigue that is occurring at the level of the spinal cord or the cortex. Magnetic stimulation can be applied to the cortex (transcranial magnetic stimulation, TMS) and an increment in torque evoked by TMS during an attempted MVC suggests that the neural drive from the motor cortex was suboptimal to activate and/or drive the motor units maximally despite maximal voluntary effort (Gandevia et al. 1996; Søgaard et al. 2006). Although spinal sources of the central fatigue cannot be excluded (because the signal passes through the spinal cord and would be influenced by inhibition occurring at that level), an increment in torque following cortical stimulation suggests that motoneurons could be activated with additional descending drive. Thus, suboptimal output from the motor cortex contributes, at least in part, to the failure in voluntary activation. Unlike the interpolated twitch technique, the contribution of failure of cortical drive to the overall decrease in voluntary activation is problematic to quantify using TMS because the amplitude of the superimposed twitch evoked by TMS cannot be expressed as a fraction of the twitch evoked by the same stimulus in the relaxed muscle. The excitability of the cortical and spinal motoneurons is substantially lower in the resting state so typically it is not possible to get a twitch contraction in most relaxed muscles (apart from the hand where direct corticospinal projections are prevalent). To get around this problem, the TMS evoked twitch is obtained with different levels of voluntary activation (i.e. 50, 75 and 100% effort) and linear regression is used to estimate the amplitude of the potentiated twitch (Todd et al. 2003).
Case Study: An Example of Central Activation Failure
I will use Joseph as a case example to illustrate the clinical application of the interpolated twitch technique. Before Joseph moved from Toronto, he used to work at Ford Motor Company in Oakville, a job that required him to repetitively take objects from one conveyor belt and place them on another. Over time, this rotational activity flared up an old hockey injury in his knee. Xray confirmed quite advanced osteoarthritis and cartilage breakdown, requiring him to have surgery. Return to work required him to rebuild his quadriceps strength. This progressed quite slowly and he was off work for nearly a year. As part of the return to work evaluation, his strength was tested with administration of the interpolated twitch technique. The presence of a superimposed twitch led to concerns that he was not putting his full effort into his rehabilitation program. His voluntary activation ratio was 0.72. The trouble with using the interpolated twitch to make such judgments is that the interpolated twitch tells you that he has central failure of voluntary activation but it doesn’t tell you why.There are several factors that can lead to such a result. First, a period of immobilization has been shown to influence voluntary activation. Experiments that immobilized a healthy limb are helpful because they separate the impact of immobilization per se from pain and/or tissue damage that would be present in real life. Seki and colleagues immobilized a hand muscle for 6 weeks and found a reduction in the maximal discharge rates of the motoneuron. It is possible that there were changes in the intrinsic properties of the motoneuron (Kernell 1966) resulting from disuse (C). Immobilization has also been shown to reduce the descending drive (Sale) (A).
Second, the presence of persistent pain can inhibit the spinal motor neurons through the small diameter afferent neurons (B). There is extensive literature to demonstrate that small diameter afferents activated by mechanical or chemical stimuli can inhibit the motoneuron. A number of paradigms have been used to evaluate this pathway. In animal models, chemical byproducts of muscle contraction have been injected and the motoneuron was inhibited. In human models, when small diameter afferents were blocked and unable to provide input to the spinal motoneurons, there was no inhibition of the H-reflex. The H-reflex is an electrical analogy of the stretch reflex; stimulation of afferent neurons will reflexly activate alpha motoneurons.
Third, a failure to voluntarily activate the muscle may be a motor control issue. Persistent pain can result in abnormal co-contraction of muscles about the joint – a way of “bracing” the joint. This reduces the net force and makes it more difficult to produce a maximal contraction. In addition, after an extended period of relative disuse, the highest threshold motor units may be difficult to recruit (use it or lose it problem).
Thus, while the interpolated twitch is very useful at detecting failure of voluntary activation and central fatigue, it does not give the practitioner license to assume the patient is simply not trying hard enough.
Peripheral Fatigue:
Skeletal muscle fatigue has often been studied in isolated muscles. This approach can be conducted from single fibre to whole muscle level. To understand the changes in contractile properties of muscle, work on whole muscle has been most revealing. Below, we will present observations on the contractile properties of whole muscle when fatigue has been imposed on the muscle. Following this, the consequences of peripheral skeletal muscle fatigue on whole body exercise will be presented.
Symptoms of Skeletal Muscle Fatigue
The development of fatigue is a process that occurs with a speed that is dependent on the exercise intensity of the individual muscles involved in an exercise. Fatigue is often quantified by measurement of the maximal voluntary force, and this is one of the early symptoms of fatigue. However, while maximal voluntary force is declining, the force elicited with submaximal frequencies may actually increase, before they decrease. This increase is associated with two potential factors: activity dependent potentiation and slowing of relaxation. The decrease in force is associated with less force for a given activation. If the fatiguing task requires maintenance of a submaximal force (continuous or intermittent), eventually additional motor units will need to be recruited to allow continuation with the task at the same force or power output. This will manifest as an increasing magnitude of EMG and corresponds with a perception that the task is more difficult.
The Force-Frequency Relationship
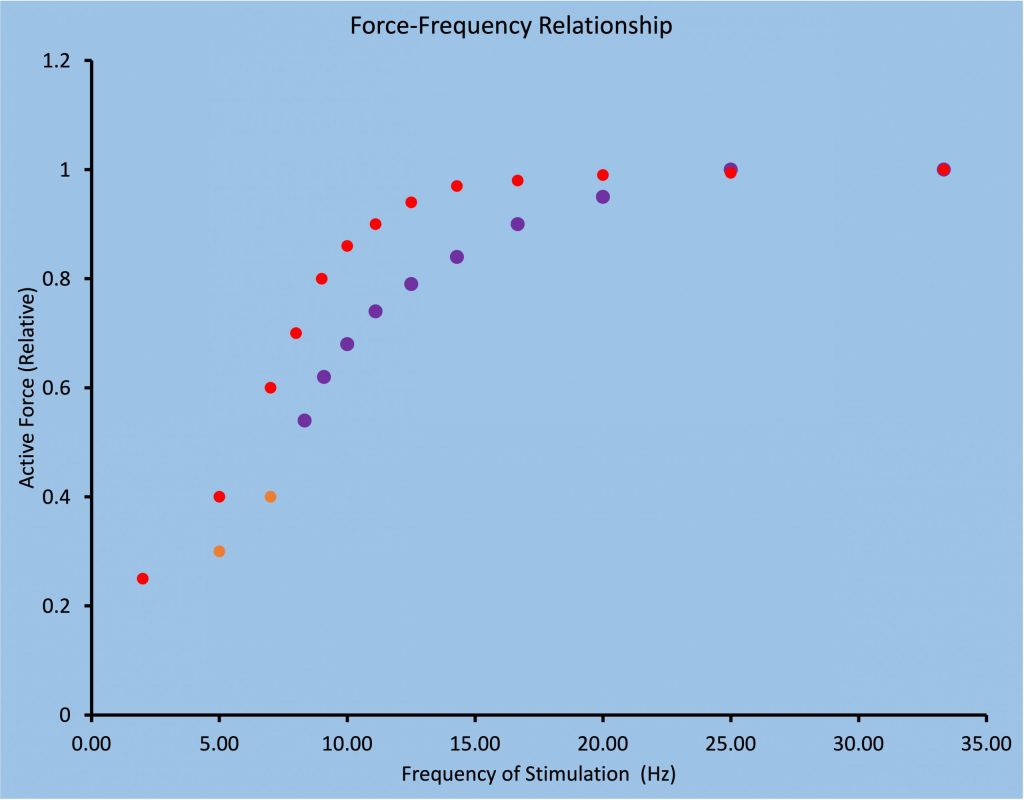
The force-frequency relationship is sigmoidal in shape and is obtained by stimulating the muscle briefly with a variety of stimulation frequencies, such that force varies from a twitch level to maximal force. For human muscle, this requires a range of frequencies from 1 to about 70 Hz. The resolution of the relationship depends on how many frequencies are tested. Figure 13-13 illustrates the force-frequency relationship for fast and slow-twitch muscle.
As fatigue develops, force for low-frequency stimulation will actually increase due to activity dependent potentiation, bur force for high-frequency stimulation will simply de crease (MacDougall et al. 2020). Figure 13-14 illustrates the change in force expected for 3 frequencies of stimulation (1, 10 and 50 Hz) for the triceps surae muscle during a fatiguing task. Measurements are presented at the times that voluntary force decreases from 100% to 80%, 50% and 25%. Note that at 1 Hz and 10 Hz, the decrease in the stimulated responses is not as great as the decrease in voluntary force generation. In fact, when voluntary force has decreased by 20%, stimulated responses are potentiated at 1 and 10 Hz. In contrast, the 50 Hz stimulated responses follow the voluntary force fairly well.

The Force-Velocity Relationship in Fatigue
As presented in Chapter 5, the force-velocity relationship can be defined by maximal isometric force, maximal velocity and the curvature of the relationship. In fatigue, all three of these parameters can change. There is a decrease in isometric force and maximal velocity and an increase in curvature (Kristensen et al. 2020). However, in some cases the curvature actually decreases, which is thought to preserve power (Devrome and MacIntosh 2018). Less curvature means force does not decrease as much as would be expected in the middle range of the force-velocity relationship.
The force-velocity relationship is thought to be important in determining power output during cycling. In this case, the relationship between torque and angular velocity is for multijoint movement, not a single muscle. The torque, angular velocity relationship of cycling cannot be obtained over the full range of velocities, because the crank limits the time available for application of force against the pedals before the range of movement dictates a necessary change in direction of movement. For this reason, the relationship is linear, not curvilinear (See Figure 13-15). This relationship is obtained by measurement of torque and angular velocity during an acceleration where measurements are made during each crank revolution. Making this measurement after a Wingate test (30 s all-out on a cycle ergometer) results in a nearly parallel shift in this relationship. When power is considered, it can be seen that peak power decreases and the optimal conditions for peak power also shift to the left.

Fatigue and the Force-Length Relationship
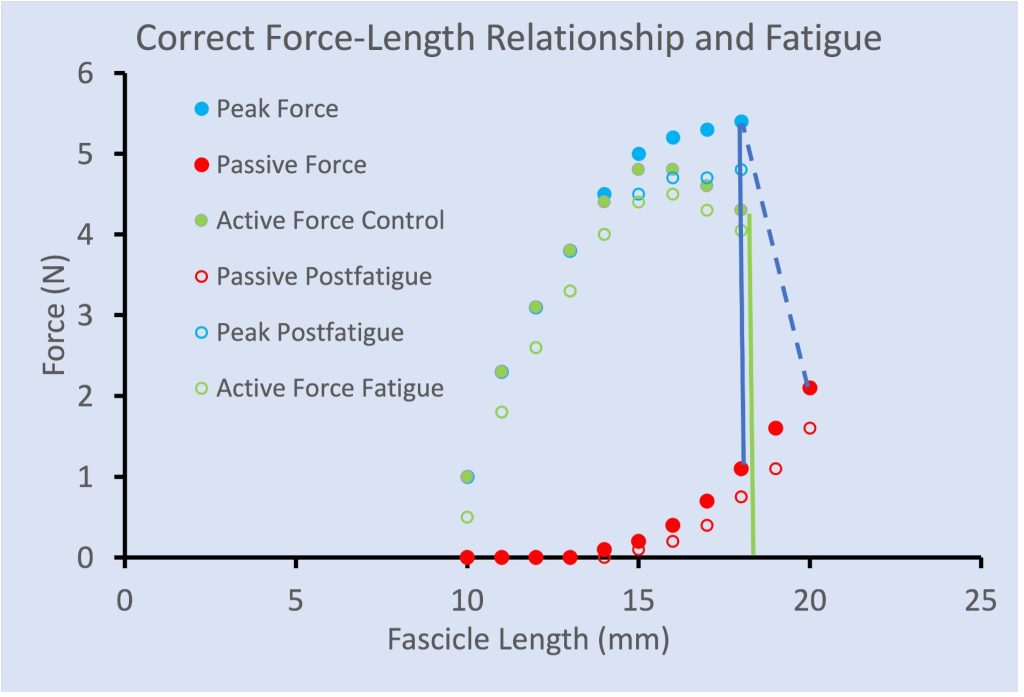
There are a few publications that illustrate greater fatigue at shorter length than at longer length, similar to that illustrated in Figure 13-16. However, it was demonstrated that this length dependence of fatigue was a consequence of inappropriate calculation of active force. Traditionally, Active force has been calculated by subtracting the passive force measured prior to a contraction. However, when a muscle contracts (fixed end contraction) the force of contraction stretches the tendon. When the contraction begins at a relatively long length, the passive force will decrease as the tendon stretches and the fascicles shorten. When active force is properly calculated (see Figure 13-17) there is a parallel shift down in active force across all lengths.

Metabolic Changes with Peripheral Fatigue
When exercise is initiated, the active motor units will experience increased use of ATP, resulting in an increase in [ADP]. However, this change in concentration of ADP is small because the metabolic control systems are geared to replenish ATP almost as fast as it is used. As a consequence of the increased metabolic replacement of ATP, the following will increase in concentration in the active myocytes: creatine, inorganic phosphate (Pi), H+, lactate and other intermediates of the glycolytic pathway. Glycogen concentration will decline in proportion to the intensity of exercise and the duration of exercise.
Considerable research has been directed towards finding the metabolic change that causes muscle fatigue, but this has been challenging. One long-standing theory of muscle fatigue is that lactate or pH are important determinants of fatigue. This theory was supported by skinned fibre measurements of inhibition of force generation caused by decreased Ca2+ sensitivity when pH was decreased (Fabiato and Fabiato 1978). It has subsequently been shown that this impairment is evident only at cool temperatures, but not at body temperature of a large mammal (Pate et al. 1995). This work illustrates how important the external validity of a study is. Lactate itself has been shown to enhance contractile response (Pannier et al. 1970), an outcome that might surprise some, but considering that lactate is as suitable a substrate as glucose for oxidative metabolism, it should not be surprising. It is now generally agreed that accumulation of lactate and/or a decrease in intracellular pH are not factors contributing to muscle fatigue in human exercise (Westerblad et al. 2002).
Accumulation of inorganic phosphate (Pi) has also been identified as a potential cause of muscle fatigue. Due to the net breakdown of creatine phosphate, intracellular Pi can increase from resting concentrations (< 10 mM) to over 30 mM. Skinned fibre experiments at room temperature consistently demonstrate decreased Ca2+ sensitivity with 25-30 mM Pi (Cooke and Pate 1985; Coupland et al. 2001; Nelson and Fitts 2014), and results at 30 show less impairment, but impaired contraction is still present. Evaluation of increased Pi at human body temperature has not been done.
Another important metabolic change associated with exercise, that has often been associated with fatigue is glycogen depletion (Bergstrîm et al. 1967). However, depletion of glycogen alone does not weaken muscles (Fitts et al. 1982). It has been suggested that low glycogen stores may have control over Ca2+ release from the sarcoplasmic reticulum (Hargreaves 2004). The suggestion that the mechanism of muscle fatigue may be a consequence of regulation in the muscle has been elaborated by MacIntosh and colleagues (MacIntosh et al. 2012a). This mechanism may be the reason that fatigue occurs with minimal disturbance to [ATP] when blood flow is maintained.
For the metabolites to accumulate in the muscle, there must be some degree of compromise of the muscle perfusion. Thus, if the force is low (approximately 20% MVC or less) the perfusion is sufficient to flush away the metabolites as they are produced. However, with higher forces, the intramuscular pressure increases and this restricts blood flow. Even in submaximal contractions, there is motor unit recruitment to offset any fatigue that is being experienced by the active motor units. With more and more of the muscle being recruited, the activity is perceived as more challenging and the reserve contractile capability gets smaller.
Special Considerations in Fatigue
The Task Dependency of Fatigue
Isometric Contractions – Low versus High Force
Much of the early work on muscle fatigue in humans was performed using maximal voluntary contractions. In classic work by Bigland-Ritchie and colleagues, both force and the electromyographic (EMG) activation declined in parallel. This observation, and others by Merton, led to the muscle wisdom hypothesis which spurred on a decade of investigation. The theory of muscle wisdom was proposed when it was discovered that 80Hz electrical stimulation was sufficient to produce the same force as a maximal voluntary contraction, fatigue occurred more quickly than a sustained maximal voluntary contraction. It was proposed that the firing rate of motor units must decrease during a maximal voluntary contraction and this was considered to be a clever way for the muscle to minimize the rate of fatigue (see below). However, it is extremely difficult to measure rate of activation of motor units during maximal activation, so this can only be considered speculation.
The muscle wisdom hypothesis stated that as the muscle fatigues, it produces less force and it produces this force more slowly. With the slowing of the muscle contractile properties, there is more fusion of the twitches at a given submaximal frequency of activation. This fusion allows better summation of forces with lower firing rates of the motor units. Thus, the nervous system can be more effective by lowering the firing rate of motor units to match the slowing of the contractile properties.
The mechanism underlying the matching of motor unit firing rate to contractile slowing with fatigue is believed to be sensory feedback from the metabolites building up in the muscle. The small diameter afferents in the muscle respond to the chemical and mechanical events in the exercising muscle and these afferents have been shown to inhibit spinal motoneurons. It is not the slowing of the muscle per se that mediates the muscle wisdom but the metabolites that are causing the slowing. For instance, cooling the muscle resulted in a slowing of the twitch but did not result in failure of voluntary activation. This suggests that slowing of the twitch, without the activation of the small diameter afferents, would not evoke muscle wisdom.
Muscle wisdom hypothesis does not hold up so well in submaximal contractions. In submaximal isometric contractions, the firing rates are much slower than in maximal voluntary contractions. Fuglevand and colleagues illustrated with computer modeling, that when motor units discharge at rates typical of submaximal contractions (30 Hz) and then slow down to 15Hz, the force produced by the muscle dropped. The muscle wisdom hypothesis predicted that the slowing of discharge rate would preserve force, which was not borne out. Several others performed experimental studies that showed that muscle wisdom applied to high-force contractions but less so to low-force contractions. The central fatigue in low-force contractions actually exacerbated the force loss. Muscle wisdom was less evident in fatiguing arm movements as well, in which a reduction in firing rate was not witnessed as fatigue developed. It was thought that muscle spindle activation from the arm movement added excitation to the motoneuron pool. This notion has been supported by an experiment in isometric contractions in which transient vibration of the muscle (vibration is known to inhibit the muscle spindle) offset the reduction of firing rates typically seen (Griffin et al.). Thus muscle wisdom is likely a phenomenon restricted to isometric conditions.
High force isometric contractions, e.g. greater than 75% of maximal voluntary contraction, experience less central fatigue than low-force contractions. The low-force contractions can be sustained for longer durations. This requires a sustained voluntary drive and it would appear that the central nervous system experiences difficulty in maintaining full voluntary activation for prolonged periods of time. You can imagine that it is much easier to maintain your concentration and motivation for short periods but this wanes with longer periods.
Many researchers have studied sustained contractions out of convenience. Whereas the classic fatigue protocol of Burke (1973) for mammalian muscle preparations, was an intermittent protocol that was able to distinguish fatigue-resistant from fatiguable motor units. In humans, intermittent contractions allow better perfusion of the muscle, thereby making the experiments much longer. And the longer the experiment, the more central fatigue. This is not only because of concentration issues as stated previously but issues of increasing discomfort in the apparatus and temperature in the restrained limb can decrease. To avoid these complicating factors, many researchers have either used sustained contractions or have performed the intermittent contractions under ischemic conditions. Neither sustained contraction nor ischemic intermittent contractions are commonly experienced in daily life. When you see Bruce Willis dangling from a ledge with only a hand hold for minutes, believe me, there is considerable artistic license in that depiction. Many a Hollywood star would have plunged to their death in real life. First, we don’t have the strength and second we would fatigue very quickly under those conditions.
Isometric Contractions: Position versus Force
Another illustration of the task-dependency of fatigue, even in isometric contractions, is the much longer times to task failure in “force tasks” versus “position tasks”. In force tasks, the subject is restrained in a device and exerts an isometric force against a transducer to match a force target. In position tasks, the subject holds a weight that requires the production of the same net torque but the limb is unrestrained and the subject tries to keep the limb in the same position. Even though the torque requirements of the task are the same, people fatigue much faster in the position task. The mechanism of increased fatiguability in the position task is thought to be neural or central fatigue. That is, the main difference between the two tasks is that subjects produce much higher EMG and earlier motor unit recruitment in the position task. This is thought to be a result of excitatory muscle spindle input from small fluctuations in position. Also the postural requirements of the position task recruits additional synergists which would exacerbate the fatigue over the force task. Therefore, the motor control strategies of performing a task must be considered with fatigue. That is, people can learn to be less fatiguable in certain tasks by changing the way the brain activates muscles to perform the task, rather than make changes within the muscle itself.
Dynamic Contractions:
Most of our activities involve dynamic contractions. Contractions, in which the limb is moving, produce power (force X velocity) and can be limited more by a slowing of the velocity of the contraction than the absolute force produced. This is especially noteable in aging and in conditions like stroke. These have been studied in isokinetic mode, meaning the velocity or angular velocity of the movements is kept constant, or in isotonic mode, meaning the force of the movement is kept constant. Dynamic movements, like the position task above, are influenced by muscle spindles because the length of the muscle is changing. Furthermore there is much better perfusion to the muscle because of the rest periods. The reduction in power (through reduced velocity) is implicated in falls in the elderly, a serious health issue.
Sex Differences
There are sex differences in low-force sustained isometric contractions, with men having shorter endurance times than women when maintaining the same relative contraction intensity (Hunter review). This sex difference is diminished when subjects are matched for strength, suggesting that much of the difference has to do with the absolute force maintained and the larger intramuscular pressures and restricted blood flows in subjects that can generate more maximal force. However just as the mechanisms for fatigue are task-dependent, so the sex differences depend on the fatiguing task. That is, studies have found no differences between the sexes in times to fatigue with dynamic contractions. Yet, when isometric contractions are intermittent, the sex differences resurface even when the sexes are matched for strength, yet cannot be solely attributed to blood flow because blood flow is not a limitation when rest is provided between contractions. Contractile properties are thought to contribute the sex difference, given that men have more fatiguable Type II muscle fibres than women. The sex-related differences in fatigue also depend on the muscle group. While both men and women experience central fatigue in low-force contractions, the amount of central fatigue is not different between sexes in the elbow flexors but is in the knee and ankle flexors. Bottom line, you cannot assume that men and women will behave similarly in fatiguing tasks!
Diseases and Fatigue
In many diseases, muscle fatigue is a common problem. It is difficult in some cases to separate the cause of the increased fatigue between the disease or the corresponding disuse. Here, we will discuss the fatigue associated with disuse, and consider a couple of disease conditions, to illustrate how disease can selectively add to the fatigue that is experienced.
Cancer –
Cancer– related fatigue is defined as a state of exhaustion that lasts longer than the activity would be expected to precipitate. This is rather common after chemotherapy and/or radiation. It is not known the extent to which neuromuscular and cardiovascular factors play a role in the fatigue. Certainly, there is a high probability for the “vicious circle”, in that fatigue leads to a reduction in activity, which can in turn lead to depression and deconditioning which can further reduce activity and increase fatigue. Cancer-related fatigue has been reported to be accompanied by a failure to voluntarily activate the muscle. However, our data show that central fatigue is prevalent in women after chemotherapy and/or radiation for breast cancer, irrespective of whether they exhibit cancer-related fatigue (Neil et al. 2013).
Neurological Conditions – Stroke:
Stroke refers to a disruption in the blood supply in the brain, either from a blockage in a vessel or from hemorrhage. Fatigue is a common symptom after stroke but this fatigue is often defined as a state of tiredness. This “tiredness” certainly has a neuromuscular component. In our study, we found that there is increased intracortical inhibition during and after a fatiguing contraction. This inhibition, is overcome by an increase in central excitation in healthy subjects and on the non-paretic side of stroke patients. When exercising with the paretic muscles, there is no increase in central excitation so the inhibition results in central fatigue. Failure to voluntary activate the muscle might be expected if the sensorimotor cortices are damaged. However, we have found central fatigue in people whose stroke occurred in sub-cortical regions of the brain. Thus the effects of fatigue are not simply caused by damage to the descending motor pathways.
After stroke, and many other neurological conditions like Multiple Sclerosis or Parkinson’s Disease, there are impairments in motor coordination and muscle weakness that make functional movement more difficult. These impairments can often make the cardiorespiratory cost of even a simple task like walking quite high. There is considerable attention being paid now to the cardiovascular deconditioning that takes place with neurological impairments. Often slow walking can actually be using quite a high percentage of their V̇O2max. So again, the vicious circle. The more difficult it is for the brain to control the muscles and movements, the more sedentary people become. Indeed, even in rehabilitation, where people are most likely to be active, the number of steps taken per day is about 10% of age-matched norms.
The restricted activity patterns in stroke results in atrophy of their fast twitch muscle fibres. After stroke, there is a tendency for the muscles to have slower contractile properties. You would think this would make the muscles less fatiguable. While the type 1 fibres remain fatigue resistant, the trouble is that the poor coordination results in an inordinate amount of motor unit recruitment, including co-contraction reducing the effectiveness. Thus the amount of EMG produced for a given force is higher in people after stroke. Considering the sense of effort is related to the descending command, these people have the perception of having to work harder to produce the required force. This leads to the central fatigue.
Conclusions
The consequences of prior activity can vary from enhanced contraction due to activity dependent potentiation to decreased force response due to fatigue. The outcome depends on several factors including sarcomere length, temperature of the muscle and the intensity and duration of the prior activity. There are three types of activity dependent potentiation: staircase potentiation, posttetanic potentiation and postactivation potentiation. Postactivation performance enhancement may or may not include enhanced contractile response. Fatigue can be central, due to failure within the central nervous system or peripheral due to failure in the peripheral nerves or the muscles themselves. Failure within the muscles may be due to disturbance to ion distribution homeostasis, or due to regulation of excitation-contraction coupling associated with an energy shortage. Fatigue is often exacerbated by disease conditions.
References
Baudry, S., and Duchateau, J. 2007. Postactivation potentiation in a human muscle: Effect on the rate of torque development of tetanic and voluntary isometric contractions. J Appl Physiol 102: 1394-1401. doi:10.1152/japplphysiol.00403.2007.
Belanger, A.Y., and McComas, A.J. 1981. Extent of motor unit activation during effort. J Appl Physiol: Respiratory, Enviro & Exercise Physiology 51(5): 1131-1135. Available from http://www.biomedsearch.com/nih/Extent-motor-unit-activation-during/7298453.html [accessed.
Belanger, A.Y., and McComas, A.J. 1989. Contractile properties of human skeletal muscle in childhood and adolescence. European Journal of Applied Physiology & Occupational Physiology 58(6): 563-567.
Bergstrîm, J., Hermansen, L., Hultman, E., and Saltin, B. 1967. Diet, muscle glycogen and physical performance. Acta Physiologica Scandinavica 71(2): 140-150.
Bigland-Ritchie, B., and Woods, J.J. 1984. Changes in muscle contractile properties and neural control during human muscular fatigue. Muscle & Nerve 7: 691-699.
Burke, R.E., Levine, D.N., Tsairis, P., and Zajac, F.E. 1973. Physiological types and histochemical profiles in motor units of the cat gastrocnemius. Journal of Physiology 234: 723-748.
Close, R. 1967. Properties of motor units in fast and slow skeletal muscles of the rat. Journal of Physiology 193: 45-55.
Cooke, R., and Pate, E. 1985. The effects of ADP and phosphate on the contraction of muscle fibers. Biophysical Journal 48: 789-798. -32676///].
Coupland, M.E., Puchert, E., and Ranatunga, K.W. 2001. Temperature dependence of active tension in mammalian (rabbit psoas) muscle fibres: effect of inorganic phosphate. Journal of Physiology 536(3): 879-891. Available from PM:11691880 [accessed.
Cuenca-Fernández, F., Smith, I.C., Jordan, M.J., MacIntosh, B.R., López-Contreras, G., Arellano, R., et al. 2017. Nonlocalized postactivation performance enhancement (PAPE) effects in trained athletes: a pilot study. Applied Physiology, Nutrition, and Metabolism: 1-4. doi:10.1139/apnm-2017-0217.
de Haan, A., Gerrits, K.H.L., and de Ruiter, C.J. 2009. Counterpoint: The interpolated twitch does not provide a valid measure of the voluntary activation of muscle. Journal of Applied Physiology 107(1): 355-357. doi:10.1152/japplphysiol.91220.2008a.
Devrome, A.N., and MacIntosh, B.R. 2018. Force-velocity relationship during isometric and isotonic fatiguing contractions. Journal of Applied Physiology. doi:10.1152/japplphysiol.01119.2017.
Edwards, R.H.T., Hill, D.K., Jones, D.A., and Merton, P.A. 1977. Fatigue of long duration in human skeletal muscle after exercise. Journal of Physiology 272(3): 769-778.
Fabiato, A., and Fabiato, F. 1978.Effects of pH on the myofilaments nd the sarcoplasmic reticulum of skinned cells from cardiac and skeletal muscles. Journal of Physiology 276: 233-255.
Fitts, R.H., Courtright, J.B., Kim, D.H., and Witzmann, F.A. 1982. Muscle fatigue with prolonged exercise: contractile and biochemical alterations. American Journal Physiology – Cell Physiology 242(1): C65-C73. Available from PM:6120654 [accessed.
Fowles, J.R., and Green, H.J. 2003. Coexistence of potentiation and low-frequency fatigue during voluntary exercise in human skeletal muscle. Canadian Journal of Physiology and Pharmacology 81(12): 1092-1100. Available from PM:14719027 [accessed.
Gandevia, S.C., Allen, G.M., Butler, J.E., and Taylor, J.L. 1996. Supraspinal factors in human muscle fatigue: Evidence for suboptimal output from the motor cortex. Journal of Physiology 490: 529-536.
Glass, L.D., Cheng, A.J., and MacIntosh, B.R. 2021. Calcium sensitivity during staircase with sequential incompletely fused contractions. Journal of Muscle Research and Cell Motility 42(1): 59-65. doi:10.1007/s10974-019-09572-4.
Gossen, E.R., and Sale, D.G. 2000. Effect of postactivation potentiation on dynamic knee extension performance. European Journal of Applied Physiology 83(6): 524-530. Available from PM:11192060 [accessed.
Gossen, E.R., Allingham, K., and Sale, D.G. 2001. Effect of temperature on tetanic in human dorsiflexor muscles. Can J Physiol Pharmacol 79(1): 49-58.
Grange, R.W., Vandenboom, R., and Houston, M.E. 1993. Physiological significance of myosin phosphorylation in skeletal muscle. Canadian Journal of Applied Physiology 18(3): 229-242.
Green, H.J., and Jones, S.R. 1989. Does tetanic compensate for low frequency fatigue? Clinical Physiology 9: 499-514.
Hamada, T., Sale, D.G., and MacDougall, J.D. 2000. Postactivation potentiation in endurance-trained male athletes. Med Sci Sports Exerc 32(2): 403-411. Available from PM:10694124 [accessed.
Hargreaves, M. 2004. Muscle glycogen and metabolic regulation. Proc.Nutr.Soc. 63(2): 217-220. Available from PM:15294033 [accessed.
Harmer, A.R., McKenna, M.J., Sutton, J.R., Snow, R.J., Ruell, P.A., Booth, J., et al. 2000. Skeletal muscle metabolic and ionic adaptations during intense exercise following sprint training in humans. Journal of Applied Physiology 89(5): 1793-1803. Available from PM:11053328 [accessed.
Keeton, R.B., and Binder-Macleod, S.A. 2006. Low-frequency fatigue. Physical Therapy 86(8): 1146-1150. Available from PM:16879048 [accessed.
Kernell, D. 1966. Input resistance, electrical excitability, and size of ventral horn cells in cat spinal cord. Science 152(729): 1637-1640.
Klein, C.S., Ivanova, T.D., Rice, C.L., and Garland, S.J. 2001. Motor unit discharge rate following twitch potentiation in human triceps brachii muscle. Neuroscience Letters 316: 153-156.
Klein, C.S., Rice, C.L., Ivanova, T.D., and Garland, S.J. 2002. Changes in motor unit discharge rate are not associated with the amount of twitch potentiation in old men. Journal of Applied Physiology 93(5): 1616-1621. doi:10.1152/japplphysiol.00414.2002.
Krarup, C. 1981. Enhancement and diminution of mechanical tension evoked by staircase and by tetanus in rat muscle. Journal of Physiology 311: 355-372.
Kristensen, A.M., MacDougall, K.B., MacIntosh, B.R., and Overgaard, K. 2020. Is curvature of the force-velocity relationship affected by oxygen availability? Evidence from studies in ex vivo and in situ rat muscles. Pflügers Archiv – European Journal of Physiology 472(5): 597-608. doi:10.1007/s00424-020-02390-5.
MacDougall, K.B., Devrome, A.N., Kristensen, A.M., and MacIntosh, B.R. 2020. Force–frequency relationship during fatiguing contractions of rat medial gastrocnemius muscle. Scientific Reports 10(1): 11575. doi:10.1038/s41598-020-68392-6.
MacIntosh, B.R. 2003. Role of calcium sensitivity modulation in skeletal muscle performance. News In Physiological Sciences 18: 222-225. Available from PM:14614153 [accessed.
MacIntosh, B.R. 2012. Postactivation Potentiation. In Encyclopedia of Exercise Medicine in Health and Disease. Edited by F.C. Mooren. Springer Berlin Heidelberg, Berlin, Heidelberg. pp. 715-718.
MacIntosh, B.R., and Gardiner, P.F. 1987. Posttetanic potentiation and skeletal muscle fatigue: interactions with caffeine. Canadian Journal of Physiology and Pharmacology 65: 260-268.
MacIntosh, B.R., and Bryan, S.N. 2002. Potentiation of shortening and velocity of shortening during repeated isotonic tetanic contractions. Pflügers Archiv: European Journal of Physiology 443: 804-812.
MacIntosh, B.R., M. Kim, and K. Svedahl. Fatigue and optimal conditions for short-term work capacity. European Journal of Applied Physiology, 92:369-375, 2004.
MacIntosh, B.R., Holash, R.J., and Renaud, J.-M. 2012a. Skeletal muscle fatigue – regulation of excitation–contraction coupling to avoid metabolic catastrophe. Journal of Cell Science 125(9): 2105-2114. doi:10.1242/jcs.093674.
MacIntosh, B.R., Holash, R.J., and Renaud, J.-M. 2012b. Control of skeletal muscle contraction: muscle fatigue is a regulated response. J Cell Sci 125: 2105-2114.
MacIntosh, B.R., Taub, E.C., Dormer, G.N., and Tomaras, E.K. 2008. Potentiation of isometric and isotonic contractions during high-frequency stimulation. Pflugers Arch 456: 449-458.
Merton, P.A. 1954. Voluntary strength and fatigue. Journal of Physiology 123: 553-564.
Neil, S.E., Klika, R.J., Garland, S.J., McKenzie, D.C., and Campbell, K.L. 2013. Cardiorespiratory and neuromuscular deconditioning in fatigued and non-fatigued breast cancer survivors. Supportive Care in Cancer 21(3): 873-881. doi:10.1007/s00520-012-1600-y.
Nelson, C.R., and Fitts, R.H. 2014. Effects of low cell pH and elevated inorganic phosphate on the pCa-force relationship in single muscle fibers at near-physiological temperatures. American Journal of Physiology-Cell Physiology 306(7): C670-C678. doi:10.1152/ajpcell.00347.2013.
O’Leary, D.D., Hope, K., and Sale, D.G. 1997. Posttetanic potentiation of human dorsiflexors. Journal of Applied Physiology 83(6): 2131-2138.
Ørtenblad, N., Nielsen, J., Saltin, B., and Holmberg, H.-C. 2011. Role of glycogen availability in sarcoplasmic reticulum Ca2+ kinetics in human skeletal muscle. The Journal of Physiology 589(3): 711-725. doi:https://doi.org/10.1113/jphysiol.2010.195982.
Pannier, J.L., Weyne, J., and Leusen, I. 1970. Effects of PCO2, bicarbonate and lactate on the isometric contractions of isolated soleus muscle of the rat. Pflugers Archiv: European Journal of Physiology 320: 120-132.
Pate, E., Bhimani, M., Franks-Skiba, K., and Cooke, R. 1995. Reduced effect of pH on skinned rabbit psoas muscle mechanics at high temperatures: implications for fatigue. Journal of Physiology 486: 689-694. Available from https://www.ncbi.nlm.nih.gov/pmc/articles/PMC1156556/pdf/jphysiol00317-0157.pdf [accessed.
Rankin, L.L., Enoka, R.M., Volz, K.A., and Stuart, D.G. 1988. Coexistence of twitch potentiation and tetanic force decline in rat hindlimb muscle. Journal of Applied Physiology 65(6): 2687-2695.
Rassier, D.E., and MacIntosh, B.R. 2000. Coexistence of potentiation and fatigue in skeletal muscle. Brazilian Journal of Medical and Biological Research 33: 499-508.
Rassier, D.E., and MacIntosh, B.R. 2002. Sarcomere length-dependence of activity-dependent twitch potentiation in mouse skeletal muscle. BMC Physiology 2(19): 1-8. Available from http://www.biomedcentral.com/1472-6793/2/19 [accessed.
Rassier, D.E., Tubman, L.A., and MacIntosh, B.R. 1997. Length-dependent potentiation and myosin light chain phosphorylation in rat gastrocnemius muscle. American Journal Physiology – Cell Physiology 273(1 Pt 1): C198-C204. Available from PM:9252457 [accessed.
Sale, D.G. 2002. Postactivation potentiation: role in human performance. Exercise and Sport Sciences Reviews 30(3): 138-143. Available from PM:12150573 [accessed.
Søgaard, K., Gandevia, S.C., Todd, G., Petersen, N.T., and Taylor, J.L. 2006. The effect of sustained low-intensity contractions on supraspinal fatigue in human elbow flexor muscles. The Journal of Physiology 573(2): 511-523. doi:https://doi.org/10.1113/jphysiol.2005.103598.
Stephenson, D.G., and Williams, D.A. 1982. Effects of sarcomere length on the force-pCa relation in fast- and slow-twitch skinned muscle fibres from the rat. Journal of Physiology 333: 637-653. -32676///].
Taylor, J.L. 2009. Point:Counterpoint: The interpolated twitch does/does not provide a valid measure of the voluntary activation of muscle. Journal of Applied Physiology 107(1): 354-355. doi:10.1152/japplphysiol.91220.2008.
Todd, G., Taylor, J.L., and Gandevia, S.C. 2003. Measurement of voluntary activation of fresh and fatigued human muscles using transcranial magnetic stimulation. Journal of Physiology 551(Pt 2): 661-671. doi:10.1113/jphysiol.2003.044099.
Tomaras, E.K., and MacIntosh, B.R. 2011. Less is more: standard warm-up causes fatigue and less warm-up permits greater cycling power output. Journal of Applied Physiology 111: 228-235. doi:10.1152/japplphysiol.00253.2011.
Westerblad, H., Allen, D.G., and Lännergren, J. 2002. Muscle Fatigue: Lactic Acid or Inorganic Phosphate the Major Cause? Physiology 17(1): 17-21. doi:10.1152/physiologyonline.2002.17.1.17.
Xu, S., Offer, G., Gu, J., White, H.D., and Yu, L.C. 2003. Temperature and ligand dependence of conformation and helical order in myosin filaments. Biochemistry 42(2): 390-401. Available from PM:12525166 [accessed.
About the Authors
Brian R. MacIntosh, Faculty of Kinesiology, University of Calgary, Calgary, Alberta, Canada

Dr. Brian MacIntosh completed his doctoral training at the University of Florida in Medical Sciences (1979) followed by postdoctoral training at Queens University in Physiology. This training was followed by faculty appointments at Concordia University in Exercise Science (1980-1986), University of Saskatchewan in Physiology (1986-1989) and University of Calgary in Kinesiology (1989-2019). At the University of Calgary, he has taught elementary and advanced undergraduate and graduate level courses in Exercise Physiology and Skeletal Muscle. Dr. MacIntosh has published research on muscle contractile properties and energetics from single cell to whole body exercise. He is a former President of the Canadian Society for Exercise Physiology and one of the first Fellows of the Society. Dr. MacIntosh introduced Exercise is Medicine to Canada, serving as Chair of the Task Force for EIMC from 2012 until 2016. He is a Fellow of the American College of Sports Medicine and Professor Emeritus at the University of Calgary.
S. Jayne Garland, Professor and Dean, Faculty of Health Sciences, Western University, London ON

Dr. S. Jayne Garland is a physical therapist who completed her doctoral training at McMaster University in neuroscience (1988) followed by postdoctoral training at the University of Arizona in the Departments of Physiology, and Exercise and Sports Science. This training was followed by a faculty appointment at Western University (1989-2009), a tenure that included eight years as Director of the School of Physical Therapy (2000-2009). Dr. Garland was Professor and Head of the Department of Physical Therapy at UBC from 2009-2015. She has been Professor and Dean of the Faculty of Health Sciences at Western University since 2016. An active researcher, Dr. Garland is recognized internationally for her innovative techniques and advances in the motor control of force production, particularly under conditions of muscle fatigue, and for applying her work in motor control to several clinical populations, including breast cancer, stroke, chronic obstructive pulmonary disease, and end-stage renal disease. She is a Fellow of the Canadian Academy of Health Sciences and received the John V. Basmajian Lectureship in 2022, which is the highest honour of the International Society of Electrophysiology and Kinesiology.
