
Chapter 6A: Energy Supply for Exercise
Brian R MacIntosh
Brian R MacIntosh
Faculty of Kinesiology, University of Calgary

Learning Objectives
After reading this chapter, you should be able to:
- Explain the processes in muscle that use energy at rest and during contraction
- Describe in general, the processes and mechanisms by which ATP is made available in response to energy needs in muscle, including: creatine phosphate, glycogenolysis, glycolysis, KREBS cycle, phosphorylation and electron transfer chain
- Describe how and why the measurement of oxygen uptake can provide an estimate of the energy requirement of muscle contraction and/or exercise
- Describe how substrates for energy metabolism are mobilized and made available
- Explain the difference between economy and efficiency and justify the use of these terms
- Describe and explain the mechanism for the slow component of oxygen upta
Key Terms
energetics, indirect calorimetry, mitochondria, aerobic energy supply, oxygen uptake, anaerobic energy supply, glycolysis, Kreb’s Cycle, Electron transfer chain, phosphorylation, biological work, adenosine diphosphate (ADP), adenosine triphosphate (ATP), creatine phosphate (CrP), inorganic phosphate (Pi), economy, efficiency, mechanical work, electrochemical gradient, enzymes, ion pump
Introduction
Physical activity requires energy. The processes that use energy and those that replenish the chemical energy supply needed by our muscles are critically important in the field of exercise physiology. Many of the systems we study in exercise physiology are designed to provide substrates for energy metabolism and to cope with the disturbance to homeostasis resulting from increased energy metabolism during exercise (see Chapter 9). This includes the pulmonary system (Chapter 7) that provides oxygen for aerobic metabolism and removes carbon dioxide from the body, releasing it to the atmosphere. The cardiovascular system (Chapter 8) delivers oxygenated blood and substrates to the active muscles of the body and removes heat, carbon dioxide and metabolic by-products of energy metabolism. The neural and hormonal systems of the body help by controlling the pulmonary and cardiovascular systems, providing the communication needed to mobilize substrates for energy metabolism and initiating processes that dissipate heat from the body and informing the brain of the magnitude of effort and disturbance to homeostasis. These systems will be introduced here and further developed later in the textbook. A recent review (Hargreaves and Spriet 2020) presents a summary of the energetics of muscle metabolism and relates this to performance of events lasting seconds to hours. This is an excellent source of additional information.
All cells of the body require energy for maintenance of the living state. The cellular processes that require energy are referred to as biological work. For most cells, these processes include ion and molecule transport, synthesis reactions and simple heat generation. Of course, our muscles produce force and motion using energy metabolism. Our cells, including myocytes use chemical energy in the form of adenosine triphosphate (ATP). All forms of biological work including those mentioned above and force generation with and without movement require energy. The use of this energy results in release of heat within the body as well as accomplishment of biological work. Considering that energy cannot be created or destroyed (the first law of thermodynamics, also known as the law of conservation of energy), these processes merely transform energy from one form (usually chemical, to another chemical form (ATP), then to biological or mechanical work and/or heat). The metabolic pathways serve to prevent the depletion of ATP during active use of our muscles. It is the release of metabolic heat in the body that makes us feel warm when we exercise. However, it is important to be able to dissipate the heat generated by our active muscles to prevent unhealthy increase of body temperature (see chapter 9 for mechanisms of heat dissipation).
ATP is the primary currency of chemical energy in the body. All cells use ATP to power reactions and processes that require energy. In this chapter we will describe the need for ATP in our muscles and the ways that it is regenerated, to prevent a decrease in ATP concentration. A decrease in ATP concentration in muscle will lead to rigor mortis, an uncontrolled and sustained state of cross-bridge engagement that disables our muscles.
Although a small amount of energy is provided by anaerobic (nonaerobic) metabolism, the measurement of oxygen uptake can provide a reasonable estimate of muscle or whole-body energetics when the exercise persists for more than a few minutes, and reaches a steady-state for oxygen uptake. After a few minutes of exercise in the moderate and low end of vigorous intensity range, the rate of oxygen uptake can account for all of the continuing energy cost of exercise. For this reason, the measurement of oxygen uptake is often used as a substitute for energy cost. This is reasonable when an accurate estimate is not needed and when the intensity is not of sufficient magnitude to require sustained contribution from anaerobic metabolism (Fletcher et al. 2009). There are circumstances that can alter the amount of energy obtained by the use of an amount of oxygen. For example, 1 L of O2 will provide 5.047 kcal (21.117 kJ) of energy if carbohydrates are exclusively metabolized and 4.686 kcal (19.606 kJ) of energy if fats are exclusively metabolized. Generally, there is a mixture of these substrates used, yielding a value somewhere between these extremes. Another factor that can influence the amount of energy obtained per litre of O2 is the P:O ratio. That is, how muchATP is generated per atom of Oxygen? See Chapter 6B for further information on this topic.
When the energy cost exceeds the anaerobic threshold (Svedahl and MacIntosh 2003), there must be sustained provision of energy from anaerobic metabolism. Under these circumstances, measurement of oxygen uptake (V̇O2) does not allow calculation of the full energy cost. This exercise cannot be sustained for more than 30-40 min. In contrast, when the energy requirement is even a little bit below the anaerobic threshold, the exercise can be maintained for hours. It is generally assumed that the body has a limited amount of anaerobic energy available, perhaps in the range of 100-125 kJ. Current theory suggests that once this anaerobic energy is used, exercise requiring anaerobic contribution cannot continue (Moritani et al. 1981).
One of the consequences of the metabolic processes that provide energy for muscle contraction and the process of muscle contraction itself is conversion of chemical energy to heat. During exercise, heat production can be considerable and would result in increased temperature of the body. Fortunately, most of this heat generated in the body during exercise is lost to the environment through processes described in Chapter 9. In the following Case Presentation, the amount of heat generated during a time-trial is considered.
Case Presentation: Heat Generation During a Time-Trial
In Chapter 16, Jake runs a 10 km time-trial and his heat generation is calculated. Here, heat generation during a marathon is calculated for Jerry. Jerry has a running economy equal to 1.15 kcal × kg-1 × km-1. This is equivalent to 4.812 kJ × kg-1 × km-1. At the time he runs the event, he weighs 65 kg, just a little less than at the time he was measured for Appendix F documentation. The distance of a marathon is 42.2 km. Remember that total energy is released in the body as work plus heat. Running a flat course will result in zero net mechanical work, which means that all of the work done during each step is absorbed and converted to heat during that or the subsequent step. The magnitude of biological work is negligible in comparison to the total energy transduction. Therefore, nearly all energy use is converted to heat. Some of this heat is lost to the ground on impact, but this small amount will be ignored. Total heat generation can be calculated by multiplying Jerry’s economy by his body mass and the distance of this race:
1.15 kcal · kg-1 ·km-1 65 kg 42.2 km = 3154.45 kcal Equation 1:
To convert this to kJ, multiply 3154.45 kcal by 4.184 kJ per kcal: giving 13198.2 kJ
This heat generation assumes that all energy cost of running is released in the body as heat. This calculation also tells us how much energy is burned in completing the marathon. Running is an oscillatory movement that results in zero net work, beyond that needed to accelerate the body to an average speed and to overcome air resistance. Assuming acceleration is complete within the first several seconds, then the work of overcoming air resistance is the only component of energy cost that would not result in heat release within the body (total energy cost results in heat plus work). For this example, we will ignore this minor component of work and assume that all measured energy contributes to heat build-up in the body. In reality, running a marathon at near record pace will result in measurable work against air resistance. This is why it is advantageous for a runner to run closely behind another runner. The air immediately behind any runner will be moving in the direction of the runner, providing less resistance to forward movement by the runner who is following (drafting).
Without heat dissipation, the release of this heat within the body would result in an increase in body temperature. The temperature increase would be approximately 1ºC for each kcal per kg. Considering body mass is 65 kg (this ignores probable body mass change during the run, due to an imbalance of water consumption and sweat loss). The use of 3154 kcal of energy would result in a 48 degrees ºC increase in body temperature. Of course, this would be lethal, so the body must have some way of dissipating the extra heat. In reality, body temperature will increase only a few ºC over the course of a marathon. At the end of a marathon in warm weather, it is not unusual for body temperature to be above 39 ºC (Cade et al. 1992) and this high temperature is thought to impair performance during the latter parts of a race.
Heat dissipating mechanisms are described in Chapter 9. The body has essentially 3 mechanisms of heat dissipation: evaporation, conduction/convection and radiation. Of these, evaporation is the most effective, particularly on a hot day when conduction/convection and radiation are ineffective. Evaporation of sweat from the body surface dissipates heat because energy is needed to convert sweat from the fluid state to the vapour state. This energy is equal to 40.65 kJ× mole-1 of water evaporated. One mole of water weighs 18 grams, which is equivalent to 18 ml, so this energy lost with evaporation is equal to 2.26 kJ×ml-1, or the volume of water evaporated is 0.44 ml × kJ-1 of heat lost. Of course, not all of the sweat produced by Jerry will be lost to evaporation. Some may drip off his body. Although this fluid will carry some of the extra heat produced during the marathon, much more heat is lost if that fluid is evaporated.
How much water would Jerry have to evaporate from his skin to dissipate the heat that would otherwise build up in his body during the marathon? If we consider not allowing an increase of body temperature, then the evaporation must be sufficient to prevent 48 °C change in body temperature.
13198.2 kJ · 0.44 ml·kJ-1 = 5844.2 ml or 5.84 litres Equation 2:
If Jerry was able to sweat enough to allow evaporation of 1 litre of water from his skin during each hour of running, and he completes the marathon in 3 hours, then he could dissipate 6780 of the 13198.2 kJ, or just over half of this heat load. If his temperature increased by 2 degrees C, he could accommodate another 1087 kJ. He still needs to dissipate 6266 kJ of heat by conduction and convection. Although he could sweat more than 1 litre per hour, it is not sweat rate we have calculated, it is the amount of evaporation. Losing sweat from the body and dripping to the ground does not cool the body. Maximal sweating rates can exceed 2 litres per hour (Baker 2017).
Now we return to our discussion of the energy cost in the body. First, we will deal with resting energy requirements, then for muscular exercise before we continue with a discussion of the metabolic sources of energy during exercise.
Resting Energy Requirements
Basal metabolic rate is the rate of metabolism in the body when no food has been consumed for 16 hours and the body has been recumbent and inactive for at least 30 min. In this state, only the essential metabolic processes of the body will be engaged. Very little energy will be used in the digestive system and muscle metabolism should be minimal, because lying down requires the least amount of muscle activation. The heart requires some energy because as long as you are alive, your heart will be beating intermittently. Similarly, the muscles that move air into your lungs will require some energy. Exhaling this air is a passive process and requires no additional energy. Other than these obvious needs for energy, most energy in this state is required to maintain ion gradients in the body. The slow leak of ions across membranes will require energy in the form of ATP to actively transport ions back across the membrane. Under these conditions, aerobic metabolism will be providing all of the energy required in the body and measurement of oxygen uptake will reveal that the body is using close to 3.5 ml · kg-1 · min-1. This value decreases with age and during food deprivation (starving) and can be increased by hormonal influence (thyroid hormone or adrenaline). Basal metabolic rate is the energy cost required to maintain your body in a state of homeostasis, when factors that would disturb homeostasis are absent. Your resting metabolic rate is sufficient to maintain your body temperature in an appropriate environment, so metabolic heat production is balanced by heat loss from the body.
While you are sitting in class, or sitting somewhere comfortable while reading this textbook, your metabolic rate will likely be slightly higher than this; 3.7-3.9 ml · kg-1 · min-1. This is because you will have some muscle activation, even if only to maintain posture or occasionally turn a page or hit a keyboard key. Your brain may be a little more active and you may still be digesting your last meal. Digestion requires energy for smooth muscle motility and transport of specific molecules across the digestive tract. If you were recently engaged in vigorous physical activity, you may also be in recovery from the exercise. The metabolic rate is increased by active use of your muscles and slowly returns to the resting state during a recovery period after the exercise. The oxygen uptake above the resting level during a recovery period is sometimes called the “excess postexercise oxygen consumption” (EPOC) (Gaesser and Brooks 1984). Others refer to this as simply the recovery oxygen uptake.
Processes that Require Energy in Muscle Contraction
As indicated above, energy is required in muscle for ion pumping and for molecular motors (actomyosin ATPase). The key ion pumps include Na+-K+ ATPase and Ca2+ ATPase which is also known as sarcoendoplasmic reticulum Ca2+ ATPase (SERCA). There are three isoforms of SERCA in the endoplasmic reticulum membranes of the human body. SERCA1 is found in the fast-twitch skeletal muscle. SERCA2 is found in cardiac and slow-twitch skeletal muscle and SERCA3 is found in smooth muscle and nonmuscle tissue. The implications of these energy-requiring processes are described below.
Ion Pumping
When an action potential is propagated in either an axon or a myocyte, Na+ and K+ move down their concentration gradients through voltage-gated ion channels, progressively along the full length of the cell (see Chapter 3). In the myocyte, this is the event that ultimately activates or “turns on” the muscle contractile process (see Chapter 5). In a resting muscle fibre, or an axon, there is a concentration gradient for Na+, K+ and Cl–. These ions are distributed across the membrane as illustrated in Figure 6A-1. Na+ and Cl– are at a high concentration outside the cell and K+ is at a high concentration inside the cell. When the channels open because the membrane depolarizes to threshold, these ions diffuse passively down their electrochemical gradient. The process of activating a muscle cell does not require energy. Recovery of ion concentration gradients does require energy. This energy, in the form of ATP is used to restore the concentration gradient for the ions that have crossed a membrane.
The voltage change associated with the action potential is detected by the dihydropyridine receptors in the transverse tubules and these modified Ca2+ channels cause opening of the ryanodine receptors; Ca2+ channels in the membrane of the terminal cisternae. The subsequent diffusion of Ca2+ into the sarcoplasm from the sarcoplasmic reticulum is a passive process, taking advantage of the open ryanodine receptors. However, to get the Ca2+ back into the sarcoplasmic reticulum requires energy.
The Na+-K+ATPase transports 3 Na+ out of the cell and 2 K+ ions into the cell for each ATP hydrolyzed. The Ca2+ATPase of the sarcoplasmic reticulum (SERCA), transports 2 Ca2+ ions with each ATP that is split. The total amount of ATP used by ion transport processes can account for 20 to 40 % of total energy cost of a muscle contraction. Factors that affect this magnitude include not only the frequency and duration of activation but any factor that will influence the amount of energy used by cross-bridges. This includes: sarcomere length, velocity of contraction, and number of motor units activated. All of these factors affect the energy cost of the acto-myosin ATPase, and frequency and duration of activation will also affect the need for ion transport. Any change in one or the other of these energy-requiring processes will alter the fraction of the total energy needed by the ion transporters.
![Intracellular and extracellular spaces are separated by a red line, representing the sarcolemma. Sarcoplasmic reticulum, containing longitudinal reticulum and terminal cisternae abutted against the transverse tubule, drawn as a downward extension of the sarcolemma. Ion distribution is illustrated with extracellular Na+ 125 mM, extracellular K+ 4 mM, extracellular Cl- 120 mM and extracellular Ca2+ 2.5 mM. Intracellular K+ is 140 mM, Na+ is 14 mM, Cl- is 10 mM and Ca2+ is .005 mM. SR free [Ca2+] is 1.5 mM.](https://pressbooks.openeducationalberta.ca/app/uploads/sites/228/2025/03/Figure6-1-1024x338.jpg)
Molecular Motors
Myosin is a molecular motor. The myosin molecule forms a cross-bridge with actin and undergoes a conformational transformation that results in exertion of force against the actin. The force can result in motion. Each myosin head can undergo repeated cycles of binding, generating force and/or motion and detaching. With each cycle of attachment and detachment, the energy associated with the terminal phosphate bond of ATP is released as Pi dissociates, resulting in the formation of ADP. This energy is converted to mechanical work and heat production. The cross-bridge cycle repeats for myosin heads with apposing actin filament binding sites along the full length of any activated muscle cell as long as [Ca2+] is maintained high enough to keep Ca2+ bound to troponin (see Chapter 5). The total amount of energy used by these molecular motors can account for 60-80% of the total energy cost of muscle contraction. In a brief muscular effort, the rate of ATP use can increase 100 times greater than the resting rate. The magnitude of ATP use is dependent on: muscle size (volume), motor unit recruitment, rate coding, fibre-type, velocity of shortening, and sarcomere length.
Quantification of Energy Cost of Muscle Contraction
Muscle activation and contraction require energy and that energy is obtained from the chemical energy released on hydrolysis of ATP resulting in the formation of adenosine diphosphate (ADP) and release of inorganic phosphate (Pi). The energy is required by 3 primary ATPase processes: myosin ATPase, Na+-K+ATPase and Ca2+ATPase. Myosin ATPase is activated by interaction of the myosin molecular motors with actin (the combination is referred to as actomyosin ATPase ) for movement or force generation. Active transport of Na+ and K+ across the sarcolemma is accomplished by an ion pump, Na+-K+ ATPase that requires ATP. Active transport of Ca2+ into the sarcoplasmic reticulum is accomplished with the Ca2+ ATPase also known as SERCA. These energy-requiring processes are depicted in Figure 6A-2.
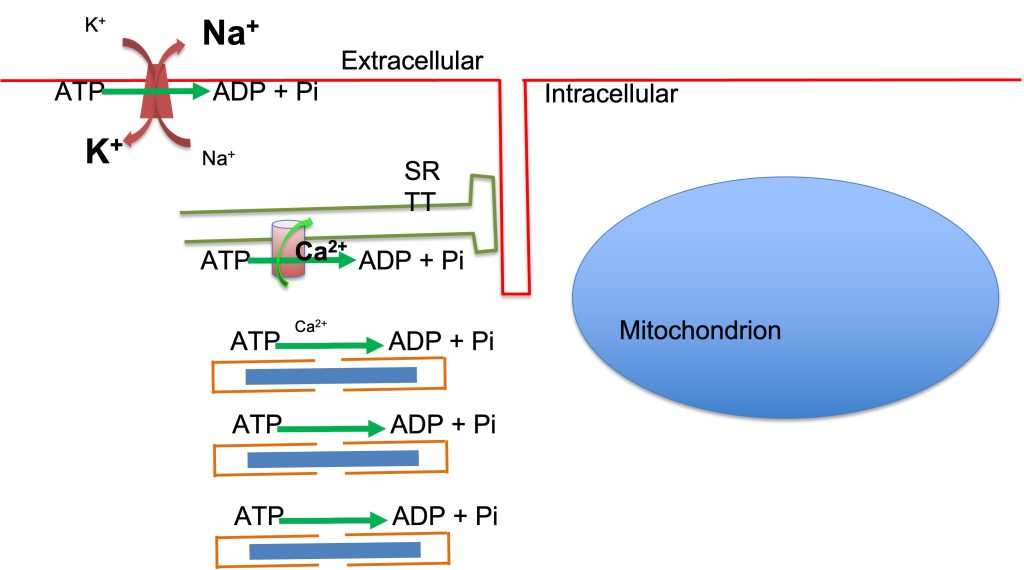
When ATP is hydrolyzed to ADP and Pi, energy previously stored in the phosphate bond is released. This energy is converted to heat and work. Work can be subdivided into mechanical work and biological work (creating molecules or supplementing ion concentration gradients). The energy cost of muscle contraction has historically been studied by careful quantification of heat released during isometric contractions and heat plus work in dynamic contractions.
Measurement of Heat During Muscle Contraction
There is a long history of the use of heat measurement to quantify the energy cost of muscle contraction. The approach has involved removing a small muscle from an animal and mounting it in a chamber that is sealed and insulated (Hill 1938). The muscle is stimulated to contract and the heat generated during the contraction is measured. The heat is quantified in joules of energy, revealing how much energy was released by the muscle. When the muscle is allowed to do work, the sum of the work plus the heat released is the total energy transduced by the muscle (the Fenn effect). Much of what we know about muscle energetics can be attributed to this technique. However, most this this work on muscle energetics was done on frog muscles at room temperature. Room temperature in the labs at Kings College London was apparently much cooler than most of us keep our houses now, so reported temperatures were often ~15 ºC. This means that much of what we know about muscle energetics does not necessarily apply to muscles functioning in the human body near 37ºC.
Measurement of Oxygen Uptake During Muscle Contraction
The measurement of oxygen uptake provides the opportunity to calculate the energy obtained from substrates (fats and carbohydrates) by oxidative metabolism. Typically, this approach can be considered to provide all of the energy for replenishment of ATP during submaximal steady state conditions when there is no continuing net anaerobic metabolism. To satisfy this condition, there must be no net production of lactate within the muscle. Any lactate produced in a given cell must be oxidized in that cell or in a neighboring cell, without getting into the blood. Under these conditions, the measurement of V̇O2 can provide an estimate of how much energy was provided to a muscle by oxidative metabolism. It is important to realize that conversion of the chemical energy in substrates like fat and carbohydrate to ATP results in loss of about 40% of the energy that was available in these substrates. This energy is lost as heat. Considering that heat is also lost when the energy in ATP is transduced to mechanical work, muscles are not very efficient. Efficiency, when considering energy transduction, is essentially the proportion of energy conserved in a useful form. Heat is not generally considered a useful form of energy for biological purposes. The best a muscle can do is approximately 25% efficient.
Muscle Contraction
Two approaches have been used to quantify oxygen uptake during muscle contractions. One requires the surgical removal of a muscle from an animal and sealing it in a chamber. The muscle can be stimulated to contract and the amount of oxygen disappearing from the solution around the muscle is the oxygen uptake. This decrease in oxygen content can be quantified with an oxygen sensor, detecting partial pressure of O2 in the chamber, and the known relationship between O2 content and partial pressure of O2. The second technique for measuring muscle V̇O2, requires isolation of the vasculature for a muscle or muscle group and measuring muscle blood flow and arterial and venous oxygen content (Gladden et al. 1978). This approach has also been used to estimate oxygen uptake of a leg during one-legged cycling exercise (Jensen-Urstad et al. 1994). This latter technique relies on the Fick principle, which quantifies the amount of oxygen delivered to the muscle and the amount that is still in the venous blood leaving the muscle. The difference is the oxygen that was left in or used by the muscle. If the total content of oxygen in the muscle has not changed, this uptake was used for oxidative metabolism.
Fick Equation: V̇O2 =Q̇(CaO2 – CvO2) Equation 3
In this equation, C represents content, a and v represent arterial and venous blood. The dot over the V and Q represents per unit of time (usually per min).
Measurement of Oxygen Uptake During Exercise
During exercise, the most common way to quantify the energy cost is by measurement of oxygen uptake; that is, by gas exchange across the pulmonary system. This approach quantifies all aerobic energy transduction in the body, so it includes the ancillary energy costs like the cost of breathing, the cost of cardiac output and the cost associated with energy-requiring processes in all the living cells in the body, including postural and stabilizing muscles which may not be directly involved in the exercise. Some of those cells will have increased energy use during exercise and some will have decreased energy use. When the exercise in question involves a substantial muscle mass, then the measured oxygen uptake is a reasonable estimate of the energy cost of the exercise. Some scientists prefer to subtract the resting V̇O2 measured prior to the exercise from that measured during exercise, yielding net oxygen uptake. The danger in doing this is that there is no guarantee that the processes using O2 prior to the exercise will continue using O2 at the same rate during the exercise. Before we consider the metabolic processes that provide energy, the measurement of oxygen uptake will be described.
Measuring Oxygen Uptake at the Lungs
When we breathe, we inhale air from the atmosphere that contains 20.93% O2, 78% N2 and the balance other gases, including CO2 which is only about .04% of the atmosphere. When we breathe out, the air that leaves our alveolar spaces will have less O2 and more CO2. The magnitude of change will depend on the blood flow and gas content of the blood flowing through the alveolar spaces and the rate of replacing the alveolar air (ventilation). Typical values for end-tidal gas (air flowing out of the lungs at the end of breathing out) concentrations, representing alveolar gas are 17% for O2 and 5- 6% for CO2. Calculating pulmonary oxygen uptake relies on the same Fick principle as described above, but substitute pulmonary values. Knowing the ventilation and the concentration (fraction) differences for O2 and CO2, the oxygen uptake and CO2 output can be calculated. This calculation is described in the special feature box that follows.
Special Feature Box
Calculation of Oxygen Uptake
To measure oxygen uptake, it is necessary to know the concentration of O2 in the inhaled air, the volume of inhaled air, the concentration of O2 in the exhaled air and the volume of exhaled air. The volume of inhaled air is not necessarily the same as the volume of exhaled air because we usually remove more O2 from the air we breathe than we add CO2. If the time for which these data apply is known, then the VO2 can be expressed as a rate (usually per min, designated by a dot over the V). V̇O2(STPD) = (V̇I(STPD) FIO2) – (V̇E(STPD) FEO2)
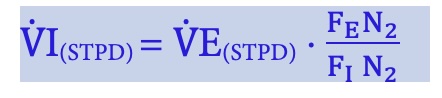
Where V̇E is expired minute ventilation, V̇I is inspired minute ventilation, STPD is standard temperature and pressure dry. The standard temperature is 273 (equal to 0 °C) and standard pressure is one atmosphere at sea level (760 mmHg). These are the conditions under which 1 mole of a gas occupies 22.4 Litres. Typically, only expiratory volume is measured, and the inspiratory volume is calculated, knowing that N2 inhaled is equal to N2 exhaled. Before this calculation can be made, the measured gas volumes must be converted to the standard condition (standard temperature and pressure dry). This is done to compensate for the effects of these parameters on the volume of gas of concern (O2 and CO2). These calculations are shown with the following equations, which assume that expired volume is measured.
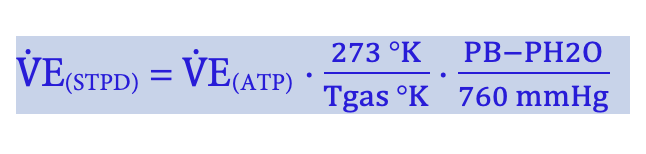
ATP, in this context, is ambient temperature and pressure, or more specifically the conditions under which the measurement was made. is temperature at which the gas volume was measured (degrees Kelvin, obtained by 273 + temperature in C), PB is barometric pressure, PH2O is partial pressure of water vapour (usually, this is saturated because exhaled air is fully saturated). Barometric pressure is typically measured in mm Hg but the units are not important if both ambient and standard pressure are expressed with the same units.
Now, the entire string can be put together:

A similar calculation can be made for determination of carbon dioxide output.

This calculation will give a negative value, indicating output, but the this is ignored when expressing the value as carbon dioxide output (V̇CO2). Now that you know how to calculate oxygen uptake, it is time to consider all of the ways that ATP is replenished during exercise. Here, a brief description of these processes will be presented. A more detailed discussion will be given in the following chapter.
Processes that Replenish ATP
The metabolic processes that replenish ATP can be described as aerobic or anaerobic, depending on whether they use O2 or not. It is important to recognize that the term “anaerobic” is used in this way when discussing metabolic processes in living tissue, in spite of the fact that oxygen is present. A true absence of O2 would be incompatible with life. The anaerobic, or non-aerobic sources of energy include: ATP, creatine phosphate (CrP) and glucose or glycogen. Aerobic energy is derived from fatty acids, glucose, glycogen and, to a small extent, amino acids. The metabolic pathways that release the energy from these substrates are briefly described in the following sections and more completely in the following chapter. The metabolic pathways rely on enzymes, special proteins that facilitate chemical reactions, to achieve their goal.
Enzymes
Chemical reactions typically will proceed only very slowly if left on their own. This is because there is often a barrier or activation energy required for the reaction to occur. Enzymes facilitate the reaction by decreasing or overcoming this activation energy. Enzyme-facilitated reactions can proceed at a rate that is thousands of times faster than the spontaneous reaction without the enzyme. Enzymes have binding sites for the reactant(s) and release the product(s) of the reaction. The rate of the reaction is still dependent on the concentrations of reactants and products. Enzymes can also have binding sites for accessory molecules that modify the rate of the reaction. This form of regulation is called allosteric regulation. In many cases, enzymes remain in an inactive state until turned on or activated by allosteric regulation. Alternatively, the enzyme may be turned on by reacting with a regulatory enzyme and then modulated by allosteric regulation. In many cases, this regulatory enzyme (a kinase) will phosphorylate the enzyme to turn it on. Another enzyme (phosphatase) may be responsible for dephosphorylating this enzyme to return it to the inactive state.
Non-aerobic Energy Sources
Chemical energy is provided by 2 processes that do not require oxygen: immediate availability of high energy phosphates, and glycolysis leading to the formation of lactate. These processes are referred to as anaerobic. Note that the term “anaerobic”, is not used in the literal meaning: – in the absence of oxygen. In discussion of living biological systems, the term anaerobic is often used to describe processes that can proceed in the absence of oxygen, but these processes can also still proceed when oxygen is present. The fact that these chemical reactions occur in living cells should not be interpreted as indicating a lack of oxygen. Although it is true that a paucity of oxygen will result in greater reliance on these processes, the fact that some ATP is produced by anaerobic metabolism should not be interpreted as oxygen is limiting the aerobic processes.
These anaerobic metabolic processes include the following:
o Decreasing [ATP]: a net reduction in [ATP] is considered providing energy by anaerobic mechanisms
o The following processes replenish ATP by anaerobic metabolism
High Energy Phosphates
ATP and CrP are considered high energy phosphates. These molecules can release substantial energy when the phosphate group (inorganic phosphate or Pi) is removed from the molecule. The energy stored in the chemical bond between a phosphate and the rest of the molecule can be used to accomplish biological work. ATP is the immediate source of chemical energy for all biological work performed in the body. The concentration of ATP in skeletal muscle at rest is in the range of 4-6 mM. During exercise, this can typically decrease by 10-30%, and during hypoxia, [ATP] can fall to 50% of the normal resting level. The fact that [ATP] does not normally decrease by very much is a testament to the ability of the metabolic pathways to replenish ATP nearly as fast as it is used in processes requiring energy. The other nonaerobic processes include the kinase reaction, the myokinase reaction and glycolysis. It is considered by some muscle physiologists that the muscle can regulate [ATP] by increasing the supply (aerobic and anaerobic metabolism) and/or reducing the rate of use of ATP (MacIntosh et al. 2012). Reducing the rate of use by impairing muscle activation is essentially a regulatory process that results in reduced force or power output that we call muscle fatigue.
The Creatine Shuttle
Consider that ATP is aerobically produced in the mitochondria and is needed for energy metabolism in the myofibrils. This separation of the location of energy use from the place where much of the energy is provided could create a problem. As you read through this section, keep in mind that to increase the rate of diffusion of molecules within the myocyte the concentration gradient must be increased. Creatine phosphate is typically available in the myocyte at rest at 3-5 fold higher concentration than ATP. This means that the potential for increasing the concentration gradient for CrP is greater than that for ATP. Also, the second factor important for the rate of diffusion of a molecule is its molecular weight. Creatine has a molecular weight of 131.13 g·mole-1 while that for adenosine diphosphate is 427.2 g·mole-1. Creatine will diffuse much faster than adenosine diphosphate. Similarly, creatine phosphate will diffuse much faster than adenosine triphosphate.
The enzyme that is responsible for the reaction depicted above in which CrP donates its Pi to ADP is kinase. Notice that the arrow indicates that the reaction can go in both directions. There are two isoforms of kinase in muscle. One of these is located at the M-line of the myofibril, right in the middle of the sarcomere. Here, this enzyme can quickly handle the ADP produced by myosin ATPase, keeping the [ADP] low by rephosphorylating it to ATP. The price of this action is that [CrP] can quickly decrease when muscle contractions begin. This reaction will result in an increasing concentration of creatine in the myofibrils. It is thought that kinase is unregulated and the rate of the reaction is dependent only on the concentrations of reactants and products.
The second isoform of creatine kinase is located in the membrane of the mitochondria. Here, kinase favours the reverse reaction, resulting in rephosphorylation of creatine. In this case, mitochondrial ATP reacts with cytoplasmic creatine to form CrP. ADP is the by-product of this reaction. This reaction has several important consequences. One consequence is that it will increase mitochondrial concentration of ADP, which in turn will stimulate oxidative metabolism in the mitochondria. The second is that it will decrease concentration of creatine around the mitochondria. Mitochondria are located in two regions within skeletal muscle; subsarcolemmal and intermyofibrillar. The use of CrP to replenish ATP in the myofibrils will result in a concentration gradient for creatine and diffusion of creatine from the myofibrils to the mitochondria. The primary advantage of CrP over simply higher [ATP] is that creatine is a smaller molecule than ADP, so creatine can diffuse faster to the mitochondria where it stimulates oxidative metabolism by undergoing the following reaction:
Cr + ATP → CrP + ADP
It is important to note that initial ATP demand is met by this important reaction and that oxygen uptake is slow to rise because ATP is provided independent of oxidative metabolism. Inhibition of creatine kinase (CK) will actually increase the rate of rise of oxygen uptake (Kindig et al. 2005), demonstrating that the slow rise in oxygen uptake at the beginning of exercise is a consequence of effective ATP regeneration by anaerobic metabolism. The additional advantage of this creatine shuttle (see Figure 6A-3) is that [ADP] in the cytoplasm can remain low. The energy charge associated with ATP hydrolysis is important for many reactions in the body, including the actomyosin ATPase. The energy charge is dependent on maintaining [ATP] and can be represented as the following:
Energy charge = ([ATP]+½[ADP])/([AMP]+[ADP]+[ATP])
Note that an increase in ADP concentration will decrease the energy charge. The resting concentration of ADP in skeletal muscle is in the micromolar range and although this increases during repeated muscle contractions, it remains in the micromolar range.
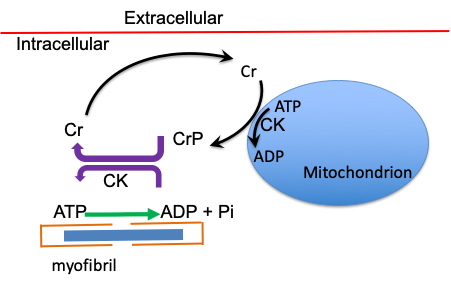
Here, the use of adenosine triphosphate (ATP) for energy in the myofibril is reflected as: ATP→ADP + Pi , where ADP is adenosine diphosphate and Pi is inorganic phosphate. The enzyme creatine kinase (CK) is located in the myofibril and catalyzes the reaction ADP+CrP → ATP + Cr where CrP is creatine phosphate, and Cr is creatine. Creatine diffuses away from the myofibril and will reach the mitochondria where the reaction proceeds in the opposite direction, catalyzed by the mitochondrial creatine kinase which is embedded in the mitochondrial membrane. The mitochondrion is typically located between myofibrils, but some also is located next to the sarcolemma.
Glycolysis: From Glucose to Pyruvate
Glycolysis is a sequence of reactions that occur in the cytoplasm, where the 10 glycolytic enzymes are located. In fact, these enzymes are known to be associated with glycogen granules and with the thin filaments. The sequence of 10 steps of glycolysis is shown in Figure 6A-4. The starting point for glycolysis is either glucose, brought in across the sarcolemma by glucose transporters (GLUT 4 or GLUT 1), or glucose-1-Phosphate, derived from cleavage of a glucose unit from glycogen, a process called glycogenolysis. Glycogen granules are prevalent in skeletal muscle and liver. The enzymes of glycolysis are located within the glycogen granules and along the thin filaments. Glycogen is a macromolecule containing branched chains of glucose. At the onset of exercise, the enzyme glycogen phosphorylase is activated, resulting in a rapid increase in the availability of glucose-1 phosphate. For this reason, glycolysis is an important means for replenishing ATP for the first minute or two of exercise. Glycogenolysis is also accelerated by the catecholamines (see Figure 6A-5). As exercise becomes more stressful, the activation of the sympathetic nervous system will accelerate glycogenolysis and provide a stimulus for increased glycolysis.
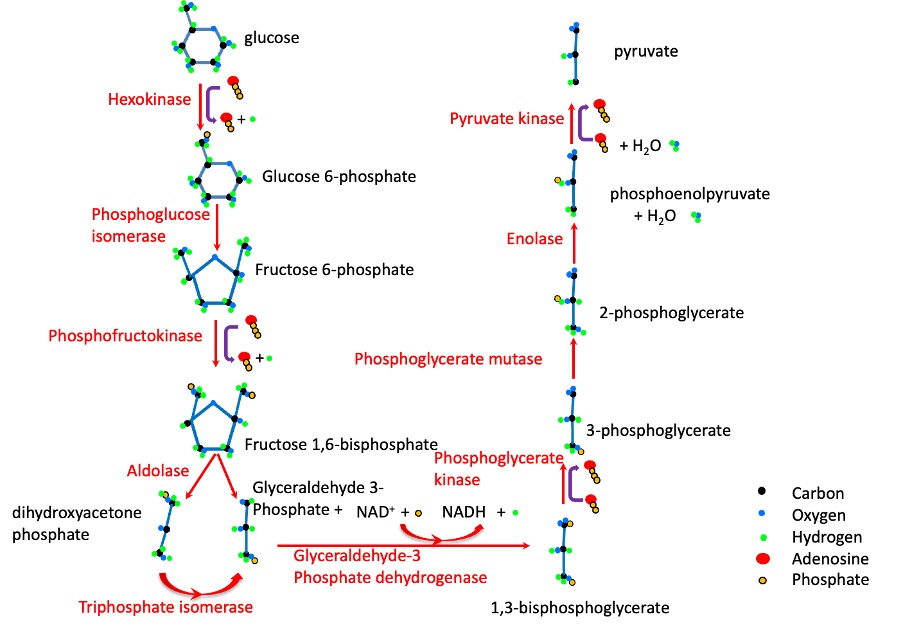
Glycolysis requires a glucose molecule as well as ADP, ATP and NAD+. The end products are pyruvate, ATP, H+ and NADH. The ATP produced in glycolysis can be used immediately for energy by the ion transporters and/or myosin ATPase. NADH can transfer electrons to the mitochondria for the electron transfer chain, or to lactate in the reaction:
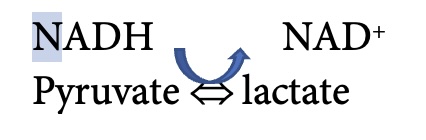
which is catalyzed by lactate dehydrogenase. This is an important consideration in the discussion of aerobic vs anaerobic metabolism. In many ways, the formation of lactate is like a holding tank for reducing equivalents and tricarboxylates. Lactate can accumulate in muscle and be transported out of a muscle to accumulate in blood and/or be taken up in another tissue (often a less active muscle). Lactate can be converted back to pyruvate for aerobic metabolism either in an adjacent myocyte or at some distance from where it was produced. Lactate can also be taken back up by the liver and used for gluconeogenesis. This conversion is referred to as the Cori cycle which is described later in this chapter.
The end-point of glycolysis is pyruvate, the precursor of the acetyl CoA, needed for mitochondrial oxidative metabolism. Pyruvate is also the precursor for lactate. Each molecule of pyruvate produced by glycolysis will either enter the mitochondria or be converted to lactate. The rate of conversion to lactate by the enzyme, lactate dehydrogenase is concentration dependent (proportional to the concentration of pyruvate). An absence or shortage of oxygen is not needed for this to occur. The entry of pyruvate to the mitochondria may be limited by a number of circumstances: transporter availability, which may also be dictated by concentration of pyruvate in the mitochondria, mitochondrial volume, and possibly oxygen availability. Oxygen is needed in phosphorylation as oxygen is the final electron acceptor in the electron transfer chain.
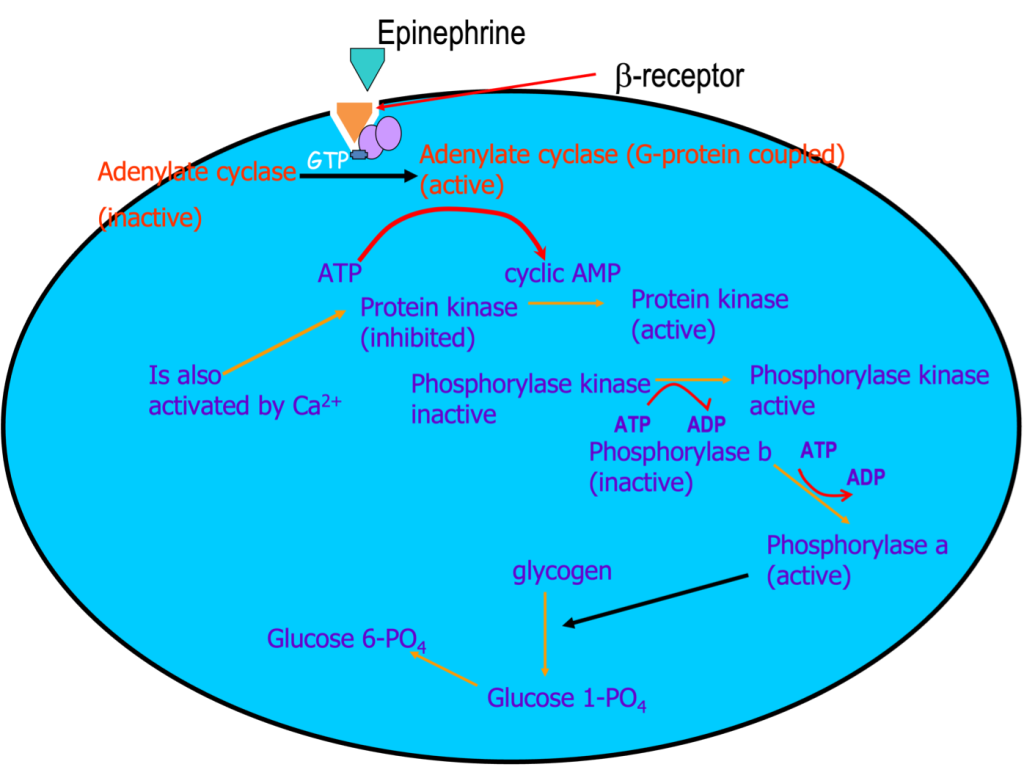
Accelerated glycogenolysis can provide the substrate for glycolysis, glucose (or more specifically, glucose 1-phosphate which needs to be transformed to Glucose 6-phosphate). Glycogenolysis is accelerated by an increase in [Ca2+] but also by the catecholamines which are commonly secreted in conjunction with activation of the sympathetic nervous system which occurs during stressful exercise. Figure 6A-5 illustrates the pathway for activation of glycogenolysis in this way. Accelerating glycogenolysis will result in a high intracellular concentration of glucose and will drive glycolysis by mass action.
Glycolysis and Lactate
The end-point of glycolysis is the formation of pyruvate. Pyruvate can be taken into the mitochondrion for oxidative metabolism, or converted to lactate in the cytoplasm. The formation of lactate results in the designation of the ATP produced by glycolysis to this point as anaerobic metabolism. The conversion to lactate can be considered the 11th step of glycolysis and this step is catalyzed by the enzyme lactate dehydrogenase, which is associated with the other enzymes of glycolysis. Although the formation of lactate is often interpreted to mean that oxygen delivery is limiting metabolism, this is not necessarily the case. In fact, lactate will be produced during glycolysis simply due to mass action. This means that even at rest a small amount of lactate will be produced and released into the blood from some muscle fibres. The higher the concentration of pyruvate, the faster the reaction proceeds (pyruvate to lactate). When glycolysis is accelerated at the beginning of exercise, pyruvate concentration will increase. This will increase the rate of lactate formation as well as the rate of pyruvate incorporation into the Kreb’s Cycle (see below). When glycolysis yields pyruvate that is oxidized in the mitochondria, the entire process is considered to be aerobic. When there is a net production (more production than disposal) of lactate, the process is considered to be anaerobic (without the use of O2).
Aerobic Energy Sources
The mitochondria, also commonly referred to as the power-house of the cell, is the site where aerobic metabolism replaces ATP that has been used to provide energy for biological work. Mitochondria are found in two locations: subsarcolemmal or intermyofibrillar. Mitochondrial structure is described in Chapter 4 and briefly recapped here, before the function of the mitochondria is described.
Mitochondria
The primary function of mitochondria is the regeneration of ATP, using the chemical energy from fats, carbohydrates and, to some extent, proteins. For example, glucose (C6H12O6) is oxidized to 6 CO2 and 6 H2O, using 6 molecules of O2. Long chain fatty acids undergo beta oxidation to form acetate which can be taken into the Kreb’s Cycle for oxidative metabolism.
Subcellular Distribution: Mitochondria are subcellular organelles, located in two general regions in myocytes. Some mitochondria are located just under the membrane (subsarcolemmal) and others are located between the myofibrils. This places the mitochondria reasonably close to where ATP is used. The primary ATPase in the sarcolemma is the Na+-K+ATPase and the primary intracellular ATPase is myosin ATPase, located in the myofibrils.. Careful 3-dimensional evaluation of mitochondrial structure reveals what appears to be a continuous structure. This has led to the mitochondria being referred to as a reticulum, rather than a series of small organelles. The volume of mitochondria in human skeletal muscle myocytes varies from about 2 to 8 % of muscle volume, with lower values in fibres that are fast-twitch fatiguable and higher values in fast-twitch fatigue resistant and slow-twitch fibres (see Chapter 4). In some species, like the bumblebee, mitochondria of the flight muscles can make up 50% of the myocyte volume.
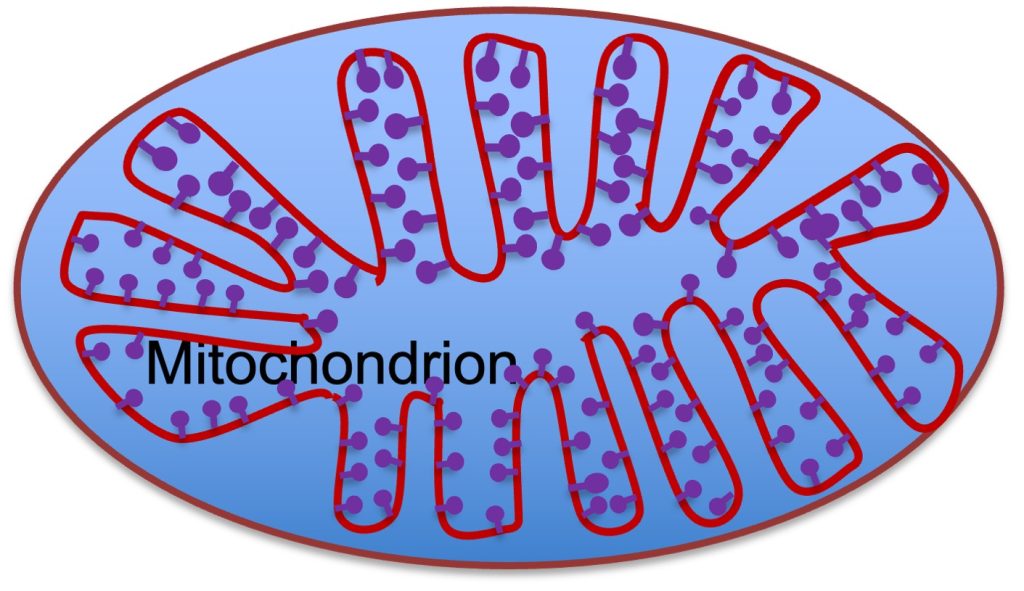
The Internal Structure of the Mitochondrial Reticulum
The mitochondrial reticulum (see Figure 6A-6) is a double-membrane structure with the internal membrane folding into the interior of the mitochondrion. These folds of the internal membrane are called cristae. The internal membrane has a series of lollipop shaped structures called F-complex (see Figure 6A-6). The F-complex is the site of active transport of H+ into the intermembrane space associated with electron transport. As electrons are passed along the cytochromes of the electron transport chain, H+ is transferred across the inner membrane. This action increases the concentration of H+ in the intermembrane space and the return of H+ to the matrix results in phosphorylation of ADP to ATP.
There is a large number of proteins associated with the mitochondrion. These proteins fall into the classification of: structural, enzymes, channels and pumps. Some of these proteins are synthesized within the mitochondria, where the genes for these proteins are located, but many of them have their genes in the nucleus of the myocyte. One advantage of local synthesis is that it avoids the difficult transport of the protein into the mitochondria.
Krebs or Tricarboxylic Acid Cycle
The Krebs Cycle is also known as the Citric Acid Cycle, because the first step in this cycle results in the formation of citric acid. When pyruvic acid enters the mitochondrion, it is decarboxylated to acetate. Acetate combines with Coenzyme A, forming acetyl CoA. Acetyl CoA reacts with oxaloacetate to form citric acid. The subsequent sequence of reactions take the 6-carbon citric acid and by removal of (2) CO2, will form oxaloacetate. In this way, this metabolic pathway is a cycle, beginning with and ending with oxaloacetate. The enzymes and chemical reactions of the Krebs Cycle are illustrated in Figure 6A-7.
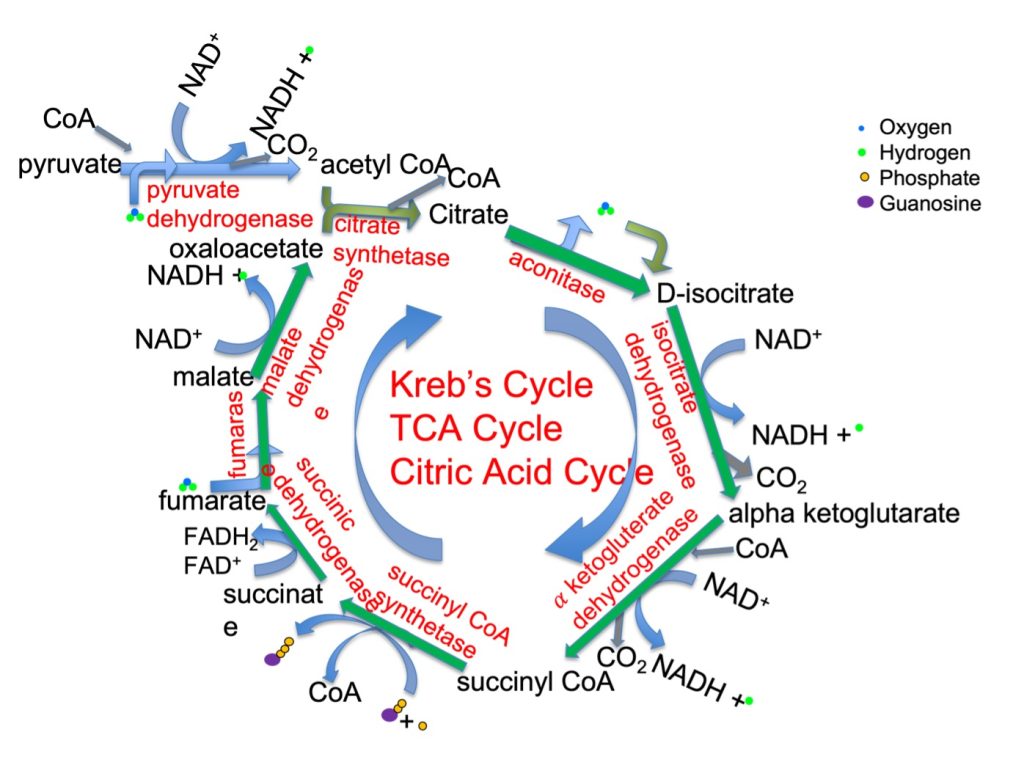
The Kreb’s Cycle, also known as the tricarboxylic acid cycle and the citric acid cycle, is a mitochondrial process associated with respiration, that takes pyruvate from glycolysis or acetyl CoA from fatty acid catabolism and generates CO2, GTP, FADH2 and NADH. The energy provided by mitochondrial metabolism is considered aerobic, because it relies on O2 as the final acceptor of electrons in the electron transfer chain. The steps of the Kreb’s Cycle follow:
- Pyruvate must be transferred into the mitochondria
- pyruvate dehydrogenase removes a CO2 from pyruvate and adds CoA to make acetyl CoA, reducing NAD+ in the process
- Citrate synthase combines acetate with oxaloacetate to make citrate, releasing CoA
- Aconitase rearranges a water making D isocitrate
- Isocitrate dehydrogenase lops off a CO2, making alpha keto glycerate and reduces NAD+ to NADH
- The formation of succinyl CoA requires a CoA and results in another CO2 and NADH
- The removal of CoA forming succinate is combined with phosphorylation of guanosine diphosphate resulting in a nucleotide triphosphate (GTP) which can transfer energy to ADP, forming ATP
- Succinate dehydrogenase converts succinate to fumarate while reducing FAD to FADH2
- Fumarase converts fumarate to malate
- Malate dehydrogenase converts malate to oxaloacetate while reducing NAD+ to NADH
An important way to consider the Krebs Cycle is to observe what goes in and what comes out. It can be seen in Figure 6A-7 that several reactants are needed for activity of the Kreb Cycle. The cycle can proceed when the following are available: acetyl CoA, oxaloacetate, GDP (guanosine diphosphate), FAD and NAD+. The Krebs Cycle reactions result in the formation of the following: oxaloacetate, NADH, FADH2, CO2, water and GTP. The GTP can be used to form ATP directly, but NADH and FADH2 must undergo further reactions to make their energy available. Before we present the Electron Transfer Chain and phosphorylation, let’s consider beta oxidation, another source of acetyl CoA for the Kreb’s Cycle.
Fatty acids are stored within myocytes and are taken up easily from the blood into the muscle cells. Beta oxidation of fats occurs in the mitochondria. This process simply cuts a couple of carbon units off a fatty acid chain, forming acetyl CoA. This acetyl CoA can enter the Kreb’s Cycle by replacing the acetyl CoA provided by pyruvate. Fatty acid metabolism is important for prolonged exercise, because glucose depletion can occur if fat is not mobilized and oxidized. Glucose is important for brain function, so it is important to preserve it.
Let’s follow each of the substances provided by Kreb’s Cycle, as ATP is regenerated for continued exercise. The oxaloacetate can react with another acetyl-CoA to keep the cycle going. The GTP can donate it’s Pi to ADP, yielding ATP. H2O is somewhat inconsequential, but metabolic production of water will delay the consequences of dehydration due to sweat loss. This is particularly relevant when glycogen loading has been accomplished because a noticeable amount of water can be released from the extra glycogen metabolism. The NADH and FADH2 that are formed by the Kreb’s Cycle, are important for stimulating the electron transfer chain and phosphorylation (see below). These are the processes that result in formation of ATP by oxidative metabolism. CO2 must be removed from the cell and ultimately from the body. This process of removal is described in Chapter 7. It should also be noted that a rise in NADH concentration in the cytoplasm will stimulate lactate formation from pyruvate, thus making NAD+ available for continued glycolysis.
Transferring Reducing Equivalents into the Mitochondria
NADH, produced in glycolysis can transfer reducing equivalents to the mitochondria via two shuttle systems: malate/aspartate shuttle and glycerol phosphate shuttle. These processes are described further in chapter 6B.
Electron Transfer Chain
The electron transfer chain, also known as the electron transport chain is a series of molecules that serve to harness the chemical energy made available from fat and carbohydrate metabolism. These molecules are located in the mitochondrial inner membrane, where they accept an electron from NADH, or FADH2 and pass that electron along the sequence of cytochromes. The energy associated with this electron is used to transfer H+ against it’s concentration gradient, from the matrix into the mitochondrial intermembrane space. This process is described in more detail in Chapter 6B.
Integration of the Metabolic Response in Exercise
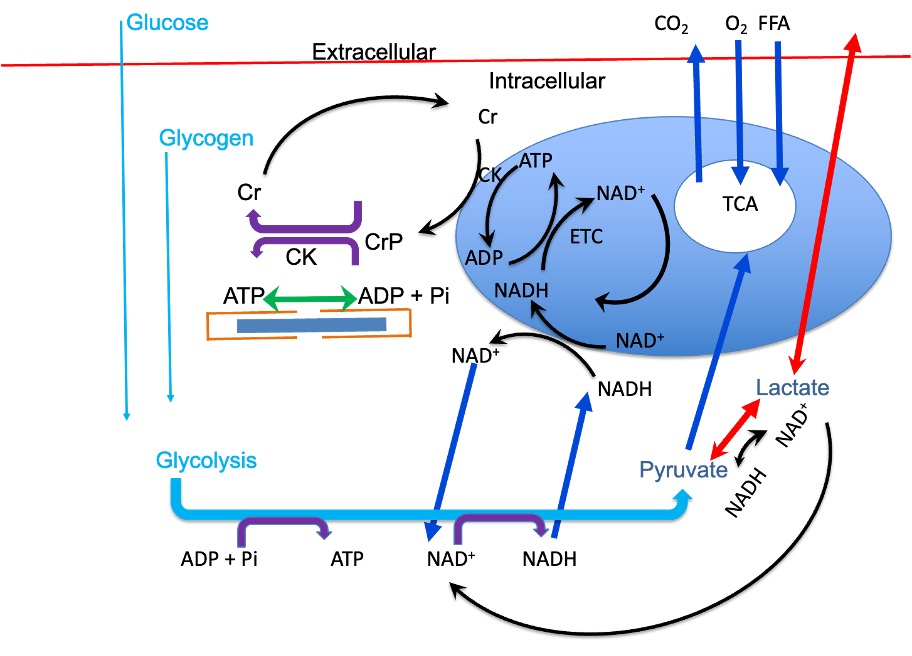
When we begin to exercise, molecular motors are engaged in our muscles to perform movement and/or force generation and work. This engagement requires energy in the form of ATP. ATP is hydrolyzed, forming ADP and the ATP must be regenerated. All three metabolic energy systems are activated, but the rate of ATP replenishment is initially greatest from creatine phosphate. The increased sarcoplasmic [Ca2+] that activates contraction also activates glycolysis in a feedforward control mechanism. The increased flux of glucose into glycolysis and the resulting formation of NADH and pyruvate will also accelerate the formation of lactate. Pyruvate will also be taken into the mitochondria for oxidative metabolism. Reducing equivalents will also be transferred into the mitochondria where phosphorylation will be accelerated, as soon as ADP is available. The increased rate of metabolism in the Kreb’s Cycle and phosphorylation will increase the rate of formation of ATP (see Figure 6A-8 for a summary of the integrative metabolic systems).
The homeostatic condition that existed at rest is disrupted by exercise. The action potentials conducted along motor axons and myocyte membranes will result in increased intracellular [Na+] and decreased intracellular [K+]. These ion concentrations will change in the extracellular space in the opposite direction. Heat will be generated within the working muscles and this heat will need to be distributed through-out the body and ultimately out of the body. Oxygen content of the venous blood will decrease and carbon dioxide content will increase. Glucose will be transported across the sarcolemma for use in glycolysis, so blood glucose should decrease. These changes are kept small by regulatory processes that are designed to minimize disturbance to homeostasis (see Chapter 9). In fact, both feed-forward and feed-back control systems are engaged during exercise and the potentially huge disturbance to homeostasis is avoided. A key element of this regulation involves the cardiovascular (Chapter 8) and pulmonary (Chapter 7) systems. Increased blood flow to the active muscles and increased ventilation serve to maintain arterial partial pressures of O2 and CO2 and increase the delivery of substrates to the active muscles while removing the products of metabolism.
Glycolysis and the Creatine Shuttle, Integrate with Oxidative Metabolism
When ATP use increases, ADP is formed. This increased concentration of ADP will stimulate glycolysis and CrP use. The increased [Cr] will stimulate oxidative metabolism. Rephosphorylation of Cr at the mitochondrial membrane (creatine shuttle) will activate oxidative metabolism. Stimulation of glycolysis will result in pyruvate and NADH formation. These products of glycolysis will also stimulate oxidative metabolism.
The Cori Cycle:
It was once thought that glucose, once it was in a muscle cell was trapped there and either used immediately in glycolysis or stored as glycogen. Glucose is released from glycogen intracellularly in its phosphorylated form and this is not easily transported out of the cell, because of the associated charge. Glucose phosphate must undergo glycolysis. However, the energy associated with glucose is not trapped in the cell. Lactate, one of the products of glycolysis, can be transported out of cells where it is produced, and appears in the blood. Blood lactate concentration rises, and this lactate is distributed throughout the body. The increase in blood lactate during exercise will result in transport of lactate into cells where lactate concentration is low. One such tissue is the liver, where lactate can be used as a substrate for gluconeogenesis. This recycling of lactate is called the Cori Cycle (Dashty 2013).
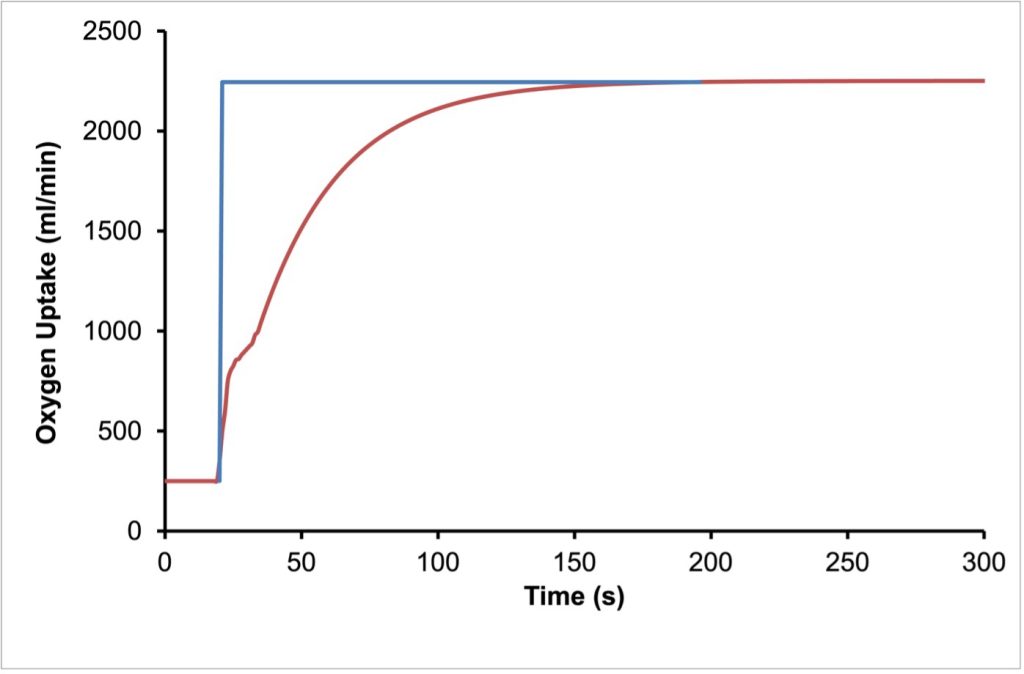
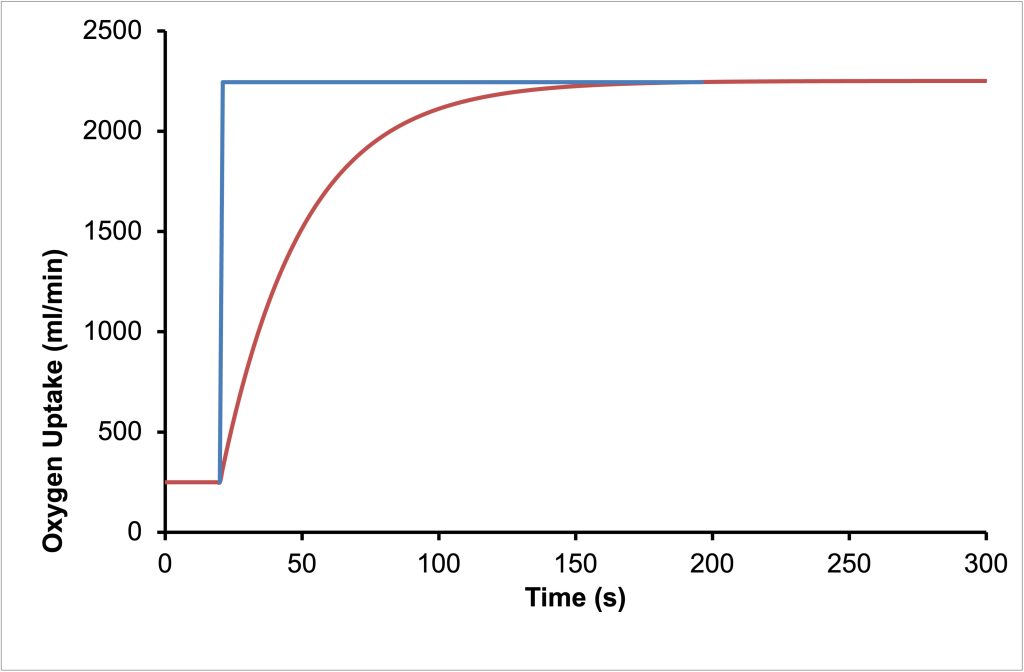
The Kinetics of Oxygen Uptake
When we transition from rest (or standing quietly) to exercise at a constant intensity, as with suddenly running on a treadmill at a constant velocity, oxygen uptake will rise quickly in three phases, known as phase I, phase II and phase III (Whipp and Wasserman 1972). The primary phase is the cardiodynamic phase. This is followed by a slower phase II or the fundamental phase and finally phase III which is either steady state or the what is known as the slow component of oxygen uptake (Poole et al. 1994). See Figure 6A-9 for a representation of the three phases of the rise in V̇O2 . If it is assumed that total energy cost of the exercise rises immediately to some constant value, then clearly V̇O2 cannot provide all of the energy for exercise, at least to begin with. As V̇O2 increases, the anaerobic provision of energy decreases. In an oxygen-centric approach, the difference between the rate of energy use and the energy provided by VO2 is referred to as the oxygen deficit. This is shown in Figure 6A-10.
Phase I of the Kinetics of Oxygen Uptake
The cardiodynamic phase is a rapid and small increase in V̇O2 that results from an increased blood flow to the lungs due to increased cardiac output. Although pulmonary blood flow increases, the oxygen content of the blood delivered to the lungs during the first 10-20 seconds of exercise is not different from that at rest. However, due to the increased blood flow, more oxygen can diffuse from the alveolae to the blood. The increased ventilation that accompanies the initiation of exercise will facilitate this increased uptake of O2. After 10-20 s, the cardiodynamic phase decreases and phase II begins superimposing a rising V̇O2 on the declining cardiodynamic phase. Phase II is caused by the arrival of more desaturated blood in the lungs. This blood is at least partly coming from the exercising muscles, where the a-v O2 content difference has increased.
Phase II of the Kinetics of Oxygen Uptake
Phase II of the rise of oxygen uptake on initiation of exercise is an exponential increase with a time-constant (t) of about 25-50 s, depending on familiarization with aerobic exercise. When exercise is no more intense than moderate exercise (at or below the aerobic threshold, see below), V̇O2 will reach a steady-state in 1.5-4 min. This phase II increase in V̇O2 represents the increased O2 use in the exercising muscles and relies on further increase in cardiac output as well as increased a- v O2 difference. The time constant for phase II can be shortened by aerobic training. With aging, the time constant is prolonged (DeLorey et al. 2004), but this prolongation also can be reversed by training (Grey et al. 2015).
Phase III of the Kinetics of Oxygen Uptake
As mentioned above, when the intensity of exercise is low enough, the V̇O2 levels off at a steady-state, SS, after about 4 x t. At these intensities of exercise, phase III is simply a constant oxygen uptake and is assumed to provide all the energy required for the exercise. Typically, the highest intensity of exercise for which a SS can be achieved is at the aerobic threshold. However, when exercise is at a higher intensity than moderate exercise, V̇O2 will either rise slowly to SS or continue to increase toV̇O2max or until exercise is terminated due to the inability to continue exercising at the required intensity. This late slow increase in V̇O2 is referred to as the slow component of oxygen uptake.
The Slow Component of Oxygen Uptake
The slow-component of V̇O2 is identified as a slow increase of V̇O2 beyond the time when a SS would have been expected. This was first described as a slow increase in V̇O2 that becomes evident after 3 min of exercise (Whipp and Wasserman 1972). Subsequently, fitting an equation to the data became popular and the slow component was identified with a third function in the equation describing the kinetics of V̇O2. This third function had a slower time-constant and a delay before starting. The mechanism of the slow component is not well understood, and only recently have viable mechanisms been proposed.
There are two current theories for the slow component of V̇O2 which has been confirmed to originate primarily in the active muscles (Poole et al. 1991). The first theory is the notion that as fatigue develops, there is an increased need for energy to be able to continue the exercise. This can be thought of as a fatigue-related inefficiency (Grassi et al. 2015). It certainly seems logical to think that muscles might become inefficient during fatigue, but the evidence for this is inconsistent. Two potential mechanisms of fatigue could lead to inefficiency: decreased Ca2+ sensitivity and decreased force per cross-bridge. Both of these mechanisms have been reported for isolated muscle, but the decreased Ca2+ sensitivity is much less likely at body temperature (see Chapter 13) and decreased force per cross-bridge appears to be most likely only in extreme acidosis (Edman and Mattiazzi 1981), which is unlikely to occur with exercise intensities below V̇O2max. Another way that fatigue might increase the energy cost of exercise would be if the fatigue led to recruitment of less efficient motor units. This idea has been proposed by several authors (MacIntosh and Holash 2000).
The second possible mechanism for the slow component of O2 is associated with the slow time-constant (tau, τ) for phase II V̇O2 when fast-twitch fibres are recruited. This theory was first proposed by O’Connell and colleagues (2017) and represents a slow transition from anaerobic to aerobic metabolic processes. It has been known for a long time that tau was longer for fast-twitch fibres, (Crow and Kushmerick 1982), but nobody had put the idea into practice.
To gain a further understanding of phase III dynamics, it is important to consider the metabolic boundary conditions described below. The slow component of O2 only occurs above the intensity of exercise for which lactate accumulation continues beyond 3 min (but not necessarily beyond 10 min. This means that those who believe that fatigue causes the slow component must believe that fatigue does not occur below the first ventilatory threshold.
Metabolic Boundary Conditions
The intensity of exercise can be quantified by the rate of energy cost for the exercise. This can be expressed in absolute terms (J or Kcal per min) or relative terms (J or Kcal pr kg per min). However, it is important to understand that a given rate of energy use can have a very different effect on homeostasis in two different individuals. There are certain metabolic boundary conditions, based on the aerobic/anaerobic contributions to the energy cost of exercise, that help us understand these differences. Regular exercise (training) can influence these boundary conditions, but there is also a genetic predisposition that affects the intensity of exercise associated with a given metabolic boundary condition. Before we address the specific metabolic boundary conditions, it is worthwhile to consider the intensity-duration relationship.
The Intensity-Duration Relationship
A universal concept of exercise physiology is that the higher the intensity of exercise, the shorter the duration that the exercise can be sustained when it is continued until the limit of endurance. This idea is illustrated in Figure 6A-11. This concept is true, whether it is considered for exercise with small muscle groups (Monod and Scherrer 1965) or whole-body exercise (Moritani et al. 1981). When the exercise can be sustained no more than 15 min, results of 3-5 time-trials can be fitted to a hyperbolic equation, as shown in Figure 6A-11. A hyperbola has a shape that approaches an asymptote on both axes. It is generally accepted that the asymptote on the axis associated with power (or speed) is identified with the anaerobic threshold and is called the power (or critical speed when intensity is quantified by this measure). When time-trials are conducted within the time-constraints of 1 min to 15 min, 2 metabolic boundary conditions can be identified: oxygen uptake and critical power. Furthermore, the work or distance accomplished above the critical intensity is considered to be work or distance achieved using entirely anaerobic energy. The nature of a hyperbola is such that this distance (area within the rectangle in Figure 6A-11) will be a constant. Before we discuss these concepts further, it is worth elaborating a little on the metabolic interpretation of the parabolic relationship between intensity of exercise and the duration this exercise can be sustained.
The Vertical Asymptote of the Intensity Duration Relationship
It can be seen in Figure 6A-11 that extrapolation of the relationship between power and duration of exercise seems to indicate that at very short duration of exercise, power is not simply extremely high, but approaches infinitely. This cannot be true. From this relationship it is important to realize that extrapolation beyond the data obtained at this short end of the relationship is not practical. Clearly, even if the exercise was only a millisecond in duration, nobody could generate anywhere near infinite power. In fact, somewhere up to about 1990 s, the concept of the intensity-duration relationship loses value of interpretation. This is because we are not capable of using all of the available anaerobic energy within this time. Success in athletic events lasting less than about 90 s is determined by something other than the total amount of anaerobic energy available. In very short duration events (high jump, long jump, 100 m, etc), success relates to the ability to generate speed or power.
Critical Intensity
Whether you have measured critical speed or critical power, the intensity of exercise you have identified is interpreted on a theoretical basis as the highest sustainable rate of aerobic metabolism. It is important to realize that although the mathematics would imply that this exercise intensity could be sustained indefinitely, this is obviously not the case. The intensity of exercise identified as critical intensity can typically be sustained for 30-60 min (Hill 1993). It is also important to realize that the longest duration of time-trial in the trials to determine critical speed affects this estimate of critical speed. Some investigators have indicated that exercise duration of the test trials can be up to 20 min, but others have stipulated that longer than 15 min is not appropriate (Drake et al. 2024). Regardless of the durations of exercise selected for the test, this is only an estimate of the anaerobic threshold.
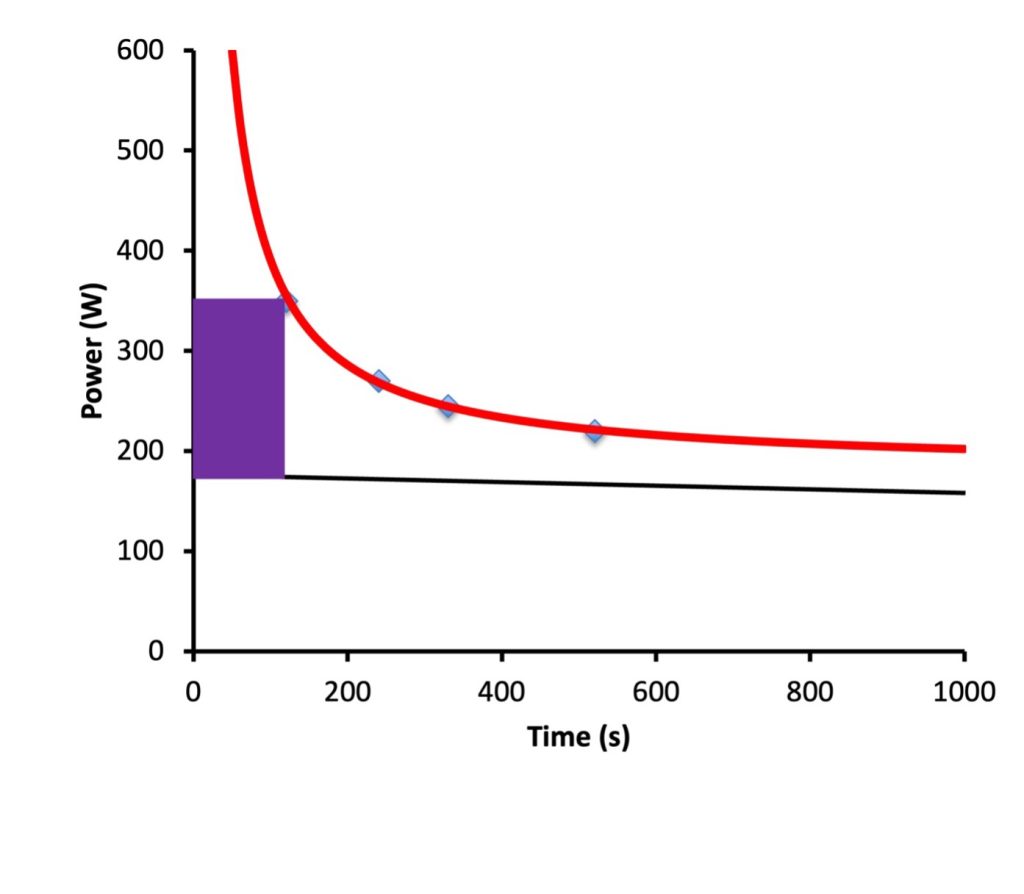
The asymptote for intensity appears to identify a power output that can be sustained indefinitely. This intensity has been assumed to represent a sustainable aerobic metabolism and has been called “critical speed” or “critical power”. In reality, this intensity of exercise can be sustained for 30-60 min, so extrapolation of the data is not appropriate.
The area under the curve, but above power (purple rectangle in Figure 6A-11) represents a fixed amount of work. This has been assumed to be work that can be accomplished with a fixed amount of anaerobic energy.
Anaerobic Threshold
When the term “anaerobic threshold” was first used in a publication, it was with reference to the intensity of exercise that is identified with the first ventilatory threshold; the intensity of exercise during an incremental test when ventilation first increases proportionately more than V̇O2 (Wasserman et al. 1973). This intensity of exercise was thought to be associated with the transition to anaerobic metabolism. However, anaerobic glycolysis is present even at rest, so it is difficult to justify this definition. Furthermore, when exercising at an intensity identified as the first ventilatory threshold, a steady state for V̇O2 can be achieved, indicating that sustained anaerobic energy contribution is not associated with this intensity. Although many exercise physiologists still use the term anaerobic threshold with this intensity in mind, it is also often used to refer to a higher threshold. Considering that a threshold is “a border or transition to a different circumstance or condition”, we define anaerobic threshold as the highest intensity of exercise that can be sustained by aerobic metabolism (Svedahl and MacIntosh 2003) . Any exercise conducted above the anaerobic threshold must have a sustained anaerobic metabolic contribution when continued to the limit of endurance. This intensity of exercise, known as a metabolic boundary, is also measured by identifying the maximal lactate steady state (MLSS), though this is often imprecise, due to the limitations of measurement. The anaerobic threshold marks an intensity of exercise below which a small decrease in intensity allows a very large prolongation of the exercise.
Aerobic Threshold
The intensity of exercise that was first referred to as the anaerobic threshold is now known as the aerobic threshold. When Wasserman and Whipp were conducting incremental exercise tests, they attributed the increased ventilation above this threshold to the need to buffer the increased H+ in the blood; they thought they had detected the threshold beyond which anaerobic metabolism was required for the duration of the exercise. However, this was not the case. This intensity is associated with ventilation without a change in the ratio of ventilation to CO2 output and has also been referred to as a boundary condition. The ratio of ventilation to V̇O2 still increases. This intensity corresponds with a mild increase in blood lactate, above the resting level during the incremental exercise test and when exercise is continued long enough, a steady state V̇O2 can be achieved, without continued contribution from anaerobic energy supply.
Maximal Oxygen Uptake
Maximal oxygen uptake ( V̇O2max) is defined as the highest value for oxygen uptake per minute that can be achieved by an individual, usually noted for a given exercise. Essentially, when exercise is performed at an intensity sufficiently high, oxygen uptake will rise to V̇O2max and will not go higher, even if the intensity of the exercise is increased. It is recognized that O2max can be different for different types of exercise, for example, V̇O2max while cycling is generally less than that while running. This difference is thought to be due primarily to the mass of muscles involved. This notion is supported by the observation that V̇O2max is even higher during cross-country skiing. However, cyclists are able to achieve a higher V̇O2max while cycling than while running, so there may be another factor involved.
The limitations to V̇O2max have long been of interest to exercise physiologists. A simplistic approach is to consider the Fick equation:
Fick Equation:
 equation 4
V̇O2 can increase if cardiac output increases or if arteriovenous oxygen content difference increases. Increased arteriovenous oxygen content difference could result from either higher arterial O2 content or lower mixed venous O2 content. These are the factors that must account for different V̇O2max values for endurance athletes vs others. Cardiac output is the variable with the greatest potential change, so it has often been blamed as the limiting factor. However, regardless of who it is who is being evaluated, arteriovenous oxygen difference could be increased if needed and that makes this author believe that V̇O2max is not limited by delivery, except in circumstances where cardiac output or arterial O2 content are compromised.
Further consideration for the limits of V̇O2max are beyond the scope of this textbook, but consider the duration that exercise of a sufficient intensity to reach O2max and the slow time-constant for the rise of V̇O2 for fast-twitch motor units. Is it possible that V̇O2max rises only until exercise approaches the limit of endurance? Also, consider the possibility that V̇O2 rises in proportion to the fall in [ADP] and that anaerobic metabolic processes prevent the further fall of [ADP], possibly due to catecholamine-induced glycogenolysis. The combined metabolic processes are capable of providing the ATP that is needed during this high intensity exercise. This possibility can be discussed as part of the topics for discussion at the end of this chapter.
Exercise and Motor Unit Recruitment
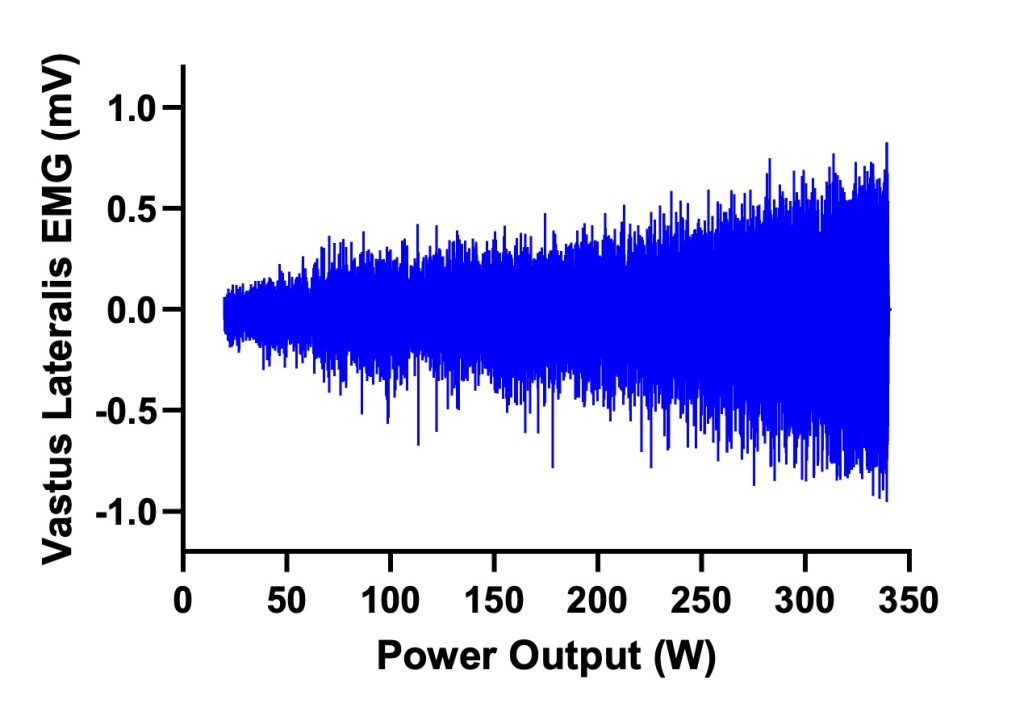
During an incremental exercise test, we are able to increase the intensity of exercise by recruitment of additional motor units as power or speed of exercise increases. It is important to recognize this, and to realize that at the intensity of exercise when we reach V̇O2max, we have not yet recruited all of the available motor units in the primary muscles used for the activity in which we are engaged. Figure 6A-12. illustrates the EMG signal that reflects increasing muscle activation, including recruitment of motor units and rate coding of active motor units as exercise intensity increases. The magnitude of EMG signal can be much higher than that observed at V̇O2max,. This is consistent with the observation that cycling power output at V̇O2max, is merely 25-35 % of the highest possible power output for cycling, such as that observed during the Wingate test. Of course, the highest power output can only be sustained for a few seconds, while power output at O2max can be sustained for 2-6 min.
The size principle governs the sequence in which motor units are activated; from small, slow-twitch units to progressively larger and faster units. Although there are exceptions to this orderly activation pattern, there is no reason to believe the size principle would be violated for incremental cycling. It could be that motor unit recruitment involves only slow-twitch units up to the intensity associated with the first ventilatory threshold (aerobic threshold). Any increase in intensity beyond this threshold may require recruitment of fast-twitch units. This would explain the rise in lactate when the first threshold is exceeded and would also explain the slow component of V̇O2. Considering that fast-twitch motor units have a slower time-constant for the rise of V̇O2, it would be expected that it would take longer to reach a steady state.
Submaximal Oxygen Uptake
During mild, moderate and vigorous exercise, oxygen uptake increases in three stages, as described above. It takes several seconds for the blood moving through the active muscles to get to the heart and subsequently to the lungs, so the fundamental phase is delayed by this time. The fundamental phase represents the resaturation of blood that has had more O2 removed than was the case at rest. As cardiac output increases, more blood will be flowing through active muscles and subsequently returning to the right side of the heart where it will be sent to the lungs for gas exchange. Why do we measure oxygen uptake?
Oxygen Uptake and Metabolic Substrate Use
We measure to estimate the energy cost of exercise. However, V̇O2 does not provide the energy – nutrient substrates do. Our mitochondria oxidize fats and carbohydrates to provide the energy for muscle contraction. This energy comes in the form of adenosine triphosphate (ATP). It must be kept in mind that ATP can also be regenerated by nonaerobic metabolism, so typically the measure of V̇O2 to estimate energy cost is done at a steady-state. This necessitates that the energy requirement will not exceed the maximal lactate steady state.
Mitochondria can use fats, carbohydrate, and to some extent, proteins to replenish ATP by aerobic metabolism. The amount of O2 used by someone during exercise can tell us how much substrate has been oxidized and therefore how much ATP has been produced by oxidative metabolism. The substrate mix is generally assumed to be fat and carbohydrate because under most circumstances, protein catabolism contributes a very small % of total substrate for aerobic metabolism. It is convenient to assume that only fats and carbohydrates are metabolized because the ratio of CO2 produced to O2 use can provide an estimate of the mix of these substrates. This works when it is assumed that only these two are providing the energy. In most circumstances, the amount of protein metabolized for ATP regeneration is sufficiently small that it does not make a huge difference to make this assumption.
The intensity and duration of exercise dictate the proportion of fats and carbohydrate that a given person will use for aerobic metabolism. When the exercise intensity is high, approaching maximal , carbohydrate is preferred (Romijn et al. 1993). At lower exercise intensities, the muscles use more fat (Brooks and Mercier 1994). A progressive increase in fat metabolism occurs as the duration of low intensity exercise increases (Mourtzakis et al. 2006). Prolonged exercise is only possible if the exercise intensity is relatively low. Considering that Jake will run most of his 10 km time-trial (see Chapter 16) above the intensity associated with his anaerobic threshold, he will metabolize predominantly carbohydrate with less than 30 % of the total energy cost coming from the metabolism of fat (Romijn et al. 1993).
The mix of carbohydrate and fat a person uses during exercise will dictate the amount of CO2 he or she releases relative to the amount of O2 they metabolize. When measured at the cellular level, this ratio is called the respiratory quotient (RQ). When carbohydrate is oxidized, the amount of CO2 released is equivalent to the amount of O2 used (RQ is 1:1). When fatty acids are oxidized, this ratio is 0.7. It is difficult to measure the cellular use of O2 and release of CO2 as this requires the measurement of the amount of O2 and CO2 going into a given muscle and the amount of these gases coming out. The difference is the amount removed or added to the blood by the muscle cells. This exchange of gases can be measured by measurement of blood flow and O2 and CO2 content in arterial (a) and venous (v) blood. The Fick equation (see equation 16-1) is used to calculate V̇O2and V̇CO2.

These measurements of blood flow as well as O2 and CO2 content require the isolation of the vascular system for a given muscle (Gladden et al. 1978). However, we can avoid this difficulty by getting an estimate of these gas exchanges at the cellular level by measurement of the exchange of O2 and CO2 at the lungs. RQ can be estimated by measurement of the respiratory exchange ratio (RER), which is the ratio of V̇CO2 · V̇O2-1 measured at the lungs. The difference between RQ and RER is that RQ represents actual metabolic production of CO2 and metabolic use of O2 while RER is the measured pulmonary exchange of these gases. When the rates of oxygen uptake and carbon dioxide output measured at the lungs are equal to the actual metabolic rates of use and production of these gases, then the RER is equal to the RQ. Under these conditions, there will be no change in the content of CO2 or O2 in the body during the period of measurement. That is, all of the CO2 that is produced metabolically will be removed by the pulmonary system and all of the O2 used in the cells of the body will be replaced by O2 moving from the lungs into the blood. This condition is not met during the first 2-4 min of exercise nor during the first several minutes of recovery. RER is considered to be equal to RQ during steady-state exercise below the aerobic threshold. However, when the exercise intensity exceeds the aerobic threshold there is a clear ventilation that serves to reduce the CO2 content of the body. This change in content violates the condition of constant content of CO2 in the body.
Substrate use changes with intensity of exercise, but training status will also influence the mix of substrates metabolized. In general, as intensity of exercise increases, fat metabolism decreases and carbohydrate metabolism increases. There is an intensity of exercise where 50 % fat, and 50 % carbohydrate areis metabolized (Brooks and Mercier 1994). This intensity of exercise is called the cross-over intensity (see Figure 6A-13). Improved physical fitness is associated with greater mobilization and metabolism of fats. Thus, a higher fitness moves the crossover intensity to higher intensities of exercise. Jake will have a higher exercise intensity (metabolic rate) at the cross-over than the student described in Table 16.1. This is important for his performance of the 10 km time-trial but would be even more important for athletes who compete over longer distances like the marathon for which carbohydrate sparing is more relevant.
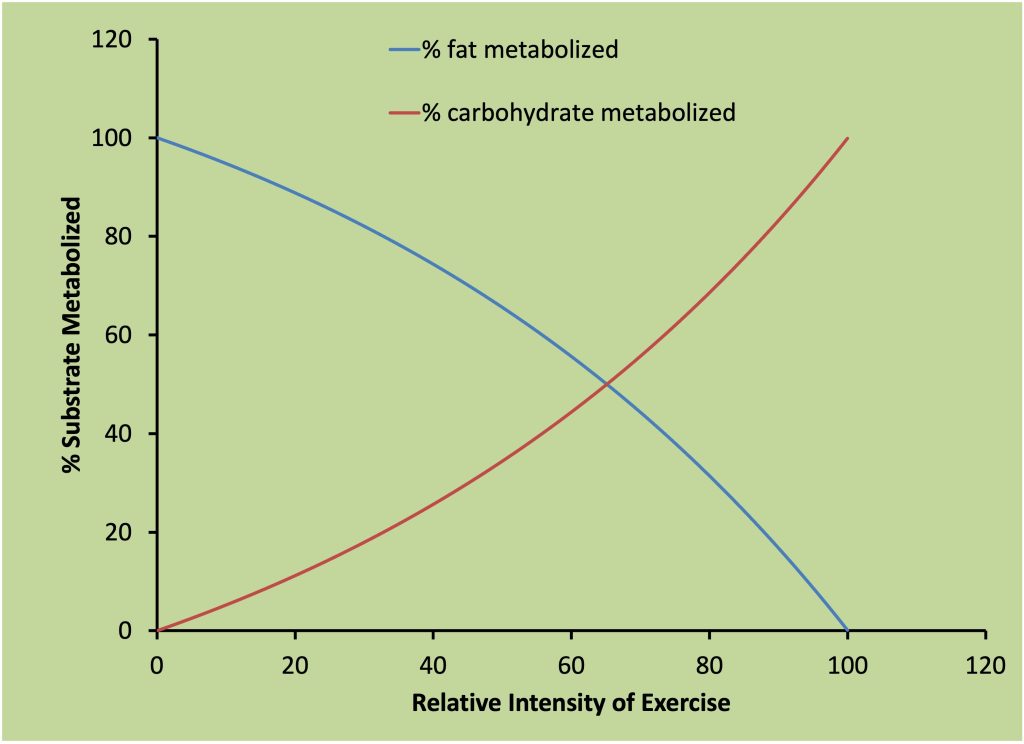
During moderate intensity exercise below the aerobic threshold, oxygen uptake will level off at a constant rate, within a few minutes. Under these conditions, O2, and CO2 content in the body will remain constant and RER will be equal to RQ during the steady phase of oxygen uptake. The mix of substrates being metabolized is appropriately estimated by measurement of pulmonary exchange of O2, and CO2. As the intensity of the exercise approaches and exceeds the anaerobic threshold, ventilation occurs. Hyperventilation results in continued net loss of CO2 from the body, so RQ ¹ RER. The substrate selection during exercise that is of such high intensity cannot be determined by estimation with measurement of RER because this ventilation results in decreases in total body CO2 content. This means the measured release of CO2 from ventilation exceeds the cellular metabolic release of CO2 and RER > RQ. However, it is reasonable to assume that the majority of substrate metabolized is carbohydrate under these conditions..
Hormonal Control of Substrate Delivery
Skeletal muscle is very good at using substrates provided to it for metabolism. The preferred substrates are fats and carbohydrates, but protein is a very good substrate as well. Factors that will affect the substrate mix include the intensity and the duration of exercise. Hormones play an important role in providing the substrates for prolonged exercise duration.
Catecholamines
Both epinephrine and norepinephrine are catecholamines. They are both released into the blood from the adrenal medulla in response to activation of the sympathetic nervous system, with the quantity of epinephrine released being greater than that of norepinephrine. Norepinephrine is also released from peripheral nerve endings of sympathetic nerves and some of this norepinephrine will find its way to the blood, contributing to the exercise-associated increase in blood or plasma catecholamine concentration. The catecholamines have several functions, many of which are critically important during exercise. One of these important functions is mobilization of substrates for exercise-related increases in metabolism. Both epinephrine and norepinephrine react with sympathetic b receptors in the membranes of hepatocytes and kidney cells. The subsequent increase in intracellular cyclic adenosine monophosphate (cAMP) concentration results in activation of enzymes responsible for gluconeogenesis, the synthesis of glucose. Glycogenolysis is also activated in the liver and in skeletal muscles by b receptor activation and subsequent increase in cAMP concentration. This increased availability of glucose will be in proportion to catecholamine concentration, which in turn is proportional to the exercise intensity.
| *Maximal refers to the intensity that elicits V̇O2max. | |||
|
Substance |
At Rest |
Moderate Intensity |
Maximal* Exercise Intensity |
|---|---|---|---|
|
Glucose |
4 mM |
4 mM |
4 mM |
|
Growth Hormone (serum) |
2 ng/mL |
8 ng/ mL |
15 ng/mL |
|
Norepinephrine |
130 pg/mL |
700 pg/mL |
2000 pg/mL |
|
Epinephrine |
20 pg/mL |
130 pg/ml |
200 pg/mL |
|
Cortisol |
450 nM |
800 nM |
1000 nM |
Muscles lack an important enzyme to allow glucose released from glycogen to leave the cell. Charged molecules are not fat-soluble, so they have difficulty passing through a lipid membrane. Glucose-1-phosphate is the product of glycolysis and it is a charged molecule. This means that any glucose released in a muscle cell from glycogen must undergo glycolysis in that specific cell. Even inactive muscle can have catecholamine-induced increases in glycogenolysis and glycolysis. This accelerated glycolysis may result in lactate production in reasonably inactive muscles. This lactate would make its way to the blood and be delivered to tissues where it can be used as an oxidative substrate. This means that inactive or mildly active cells will use lactate as an oxidative substrate (Bergman et al. 1999). Even the heart can use lactate as a substrate for oxidative metabolism. Alternatively, this lactate can contribute, along with lactate coming from intensely active muscle, to gluconeogenesis in the liver and kidneys or to accumulation of lactate during exercise above the anaerobic threshold. The accumulation of lactate from inactive muscles with accelerated glycogenolysis could be a factor in determining the intensity of exercise associated with the anaerobic threshold.
Growth Hormone
Growth hormone is also known as somatotrophin. Although best known for the essential role in growth and development, somatotrophin is also instrumental in mobilizing substrates for exercise metabolism. This would explain why somatotrophin concentration in Jake’s blood increases during exercise in spite of the fact that he is a full-grown adult. Somatotrophin is released from the anterior pituitary gland in response to a chemical signal (growth hormone releasing factor) from the hypothalamus. One of the key consequences of increasing somatotrophin concentration in the blood is increased lipolysis in adipose tissue. This lipolysis results in increased free fatty acid concentration in the blood and increased delivery of fatty acids to active muscle. Increased delivery of fats to the active muscles will result in carbohydrate sparing (use of fewer carbohydrates). The rate of use of glucose will decrease, provided the intensity of the exercise permits this. This change is not an important factor for Jake during his time-trial because his intensity of exercise is high enough that he will primarily use glucose during his run.
Glucagon
Glucagon has the opposite effect on cells of the body that insulin has. Glucagon is released from the pancreas when blood glucose concentration falls and will encourage an increase in blood glucose concentration. In contrast, insulin will cause blood glucose concentration to decrease. Glucagon stimulates liver glycogenolysis and gluconeogenesis. Activation of the sympathetic nervous system increases the secretion of glucagon.
Insulin
As indicated above, glucagon and insulin have opposing effects. Insulin is important in promoting a decrease in blood glucose concentration when ingestion of sugar-rich foods causes blood glucose to rise. Insulin is secreted from the pancreas in response to elevated blood glucose. An increase in insulin concentration results in a greater rate of transport of glucose into many cells of the body, including adipocytes and myocytes.
It is important to acknowledge that insulin is not required to promote glucose uptake in active skeletal muscle. The process by which glucose transport is augmented during muscle contraction is independent of insulin. During exercise, insulin concentration will decrease, even when glucose concentration is not changed from resting values. Muscle contraction has a mechanism to enhance glucose transport.
In the cytoplasm of myocytes, there are rafts of glucose transporter (GLUT 4) and signalling mechanisms will mobilize the transporter to the membrane and activate it to increase the rate of transport of glucose across the membrane. This increased transport can be initiated by either insulin or increased Ca2+ in the myoplasm (Richter and Hargreaves 2013). Details of this mechanism are presented in Chapter 6B.
Cortisol
Cortisol, like the catecholamines, comes from the adrenal gland. However, the catecholamines come from the adrenal medulla whereas cortisol comes from the adrenal cortex. Cortisol is considered to be a stress hormone. When the body is stressed, cortisol secretion will increase. Cortisol supports gluconeogenesis by inhibiting protein synthesis and increasing protein catabolism. The release of amino acids into the blood provides important substrates for gluconeogenesis in the liver. Cortisol also facilitates transport of amino acids into hepatocytes for subsequent gluconeogenesis.
Efficiency and Economy of Exercise
Efficiency, or more correctly, mechanical efficiency is the ratio of the work accomplished to the energy cost of doing that work. Economy is the energy cost of performing a task, like running from point A to point B. Efficiency is a unitless ratio, often expressed as a %. Economy is usually expressed as an energy cost per distance travelled, but considering it is the energy cost for a task, expression can have a variety of forms. A special case of economy is the economy of force maintenance. This is the energy cost to maintain a given force or support a load when contractions are isometric. In all cases, the energy cost of the exercise must be estimated and should be expressed in joules, the ISI unit for energy. Energy may also be expressed in other units, like calories.
Efficiency: What is it Good For?
Skeletal muscles can be as efficient as internal combustion engines (the motors in nonelectric vehicles that use gasoline for fuel). That does not say very much, considering that the best an engine can do is about 25%. This means that about 25% of the energy use can be converted to work. The remaining 75% is dissipated as heat. The maximal efficiency of our muscles is typically about 25% when energy is considered to be supplied by fat and carbohydrate for oxidative metabolism. Measuring oxygen uptake and estimating the energy made available by oxidative metabolism is the most common way to estimate the energy cost of exercise. However, just like an internal combustion engine, the efficiency is dependent on the work done. Considering the force-velocity and corresponding power velocity relationship (see Figure 6A 15), there are circumstances when the muscles will contract and not produce any work or power (rate of doing work). This happens at each end of the power-velocity curve. This is kind of like revving the engine and not going anywhere, or trying to push an immobile wall (with your muscles or with your car). No work is done, so efficiency is zero.
During an isometric contraction, no work is accomplished. Also, when the load is zero, no work is accomplished. Realistically, the zero load condition is difficult to achieve, and truly isometric contractions are uncommon. When a muscle contracts with no motion of the joints, the muscle may shorten while the tendon elongates and force develops. This internal work may preserve energy for a short time, in the stretched tendon. However, if the muscle relaxes without joint motion, then no external work has been accomplished and efficiency is zero. For this reason, economy of force production is often used to quantify the effective energy cost of maintaining a force.
Different Ways to Calculate Efficiency
Quantifying efficiency when substantial work is done is a convenient way of comparing individuals and gaining an understanding of the energetic requirements of exercise. There have been several ways that efficiency has been calculated, and we will review those here. In all cases, calculation of efficiency requires measurement of energy cost and work (or rate of energy use and power). The ratio of these, each expressed in the same energy units will result in a unitless value which can be multiplied by 100 to express efficiency as a %.
The energy cost of exercise can be calculated by measurement of VO2 and estimate of the caloric equivalent of the substrates metabolized. The amount of energy released with each liter of O2 used in metabolism can vary, depending on the substrates used. It is generally assumed that oxidative metabolism relies on fats and carbohydrates, and the RQ indicates the mixture of these substrates that has been used. Respiratory exchange ratio (RER, VCO2/VO2 is a reasonable substitute for RQ when exercise is in a steady state.
The quantification is as follows:
Energy = RQ * 5153.3 + 15963
Where RQ is the unitless ratio of VCO2/VO2. This value obtained is the energy in joules (divide by 1000 to get kilojoules) per liter of VO2. If you multiply this by the oxygen uptake in litres, you will obtain the total energy made available by oxidative metabolism.
Gross Efficiency
When efficiency is calculated using the total measured oxygen uptake, and total work accomplished, then the value obtained by work/energy cost is the gross efficiency. No baseline has been subtracted. This calculation expresses to true cost for the human body to complete the work. This is the most common approach and arguably the most appropriate (MacDougall et al. 2022).
Net Efficiency
It is common to subtract the resting energy use from the total energy use and divide the work by this net energy cost. The resulting value is referred to as net efficiency. It is important to recognize that use of this approach assumes that the resting energy use continues to be used during the exercise, without contributing to accomplishment of the exercise . Although this may seem like a reasonable approach, it has not been proven that this assumption is correct.
Work Efficiency and Delta Efficiency
The term “work efficiency” has been used to describe a special baseline subtraction technique where energy cost for a zero work condition is subtracted from that for a condition where work is accomplished. For example, cycling at 80 RPM and no resistance and cycling at 80 RPM with some resistance. In the former situation, no work is accomplished. The assumption here is that the energy used for the zero work condition continues to be used in the work condition (when resistance is applied), without contributing to the completion of work. This cannot be assured, and although it seems like a logical approach, one circumstance would appear to violate this calculation. Cadence is kept constant for the trials at zero work and with work. It is assumed that velocity of shortening of muscles is therefore the same between the two conditions. If this was true, then it would seem logical that accomplishment of the additional work was achieved through recruitment of additional motor units and the extra energy was used to accomplish the extra work. Work efficiency would be considered an efficiency of the recruited muscles to achieve the added work. However, the velocity of shortening of muscles is not likely kept constant when resistance is added. The muscles must develop more force, and this will result in extra stretch of the tendons, which are in series with the active muscles. Considering that the muscle tendon unit is still moving at the rate needed to achieve whatever the cadence is, any variation in stretch of the tendon will alter the length change of the muscle fibres. A difference in length change will be reflected in a difference in average velocity of the fibres. Any change in velocity will affect the conditions of the cross-bridges that were assumed to have accomplished the zero work condition. The fundamental assumption has been violated.
Delta efficiency is an extrapolation of the case of work efficiency, and has often been proposed to be an estimate of muscle efficiency (Gaesser and Brooks 1975). To calculate delta efficiency, two or more trials at the same cadence, but different resistance will be completed and the energy cost quantified. Delta efficiency is the difference in work divided by difference in energy cost). The same argument above applies here. This has recently been defended (MacDougall and MacIntosh 2024).
Highlight Box
Calculating the power output of cycle ergometry, based on a standard Monark cycle ergometer. Cycle ergometry is often used in the study of the energetics of exercise. Calculation of work and power is relatively simple.
- Standard abbreviations
- meter, m
- joule, J
- watt, W (note that watt, newton and joule are not capitalized when written out fully)
- second, s
- minute, min
- kilogram, Kg
- newton, N
Tension on the flywheel is often measured in Kg. Force or tension should be expressed in newtons.
1 kg = 9.81 N
Work is force times distance. The distance travelled by a point on the flywheel at the radius where the belt is in contact is 6 m per crank revolution. This estimate is based on the circumference of the flywheel associated with belt contact and the ratio of the chain ring and free wheel cog count (typically 52:14), indicating that the flywheel will rotate 52/14 times for each rotation of the crank.
1 J = 1 Nm
Power is work / time; expressed as watts (1 watt = 1 J·s-1)
When resistance is 9.8 N, work per crank revolution is 9.8N * 6m = 58.86 Nm per crank revolution
For a pedal rate of 80 RPM, this is 4708.8 J×min-1 or (dividing by 60 s), 78.48 J×s-1
1 joule×s-1 is 1 W so this is 78.48 W.
When a mass of 1 kg of resistance is applied to the belt on the flywheel, the power output at 80 RPM will be 78.48 watts.
Based on this approach, power can be calculated for different combinations of crank rate and resistance. Note that body weight is supported while cycling, so body weight is not a factor in the power output of cycling. Body weight is also not a factor in the energy cost of cycle ergometry, so the expression of energy cost is not expressed per kg of body mass, like running is.
Energy Transduction
It is important to realize that the first law of thermodynamics dictates that energy cannot be created or destroyed. When someone refers to “energy production” in the context of exercise physiology, they likely are referring to energy transduction. Energy can be transformed from one form to another. The forms of energy in the body include: chemical, heat, kinetic, and potential. External work can be accomplished by imparting kinetic or potential energy to an external object or increasing the potential energy of the body or a body part. Our muscles transduce chemical energy, releasing this as heat and work in a variety of proportions. Efficiency of mechanical work can vary from zero to about 26%. Conditions need to be optimal to achieve close to 26%.
Efficiency When Work is Optimized
The use of the term “efficiency” is associated with a variety of definitions and concepts. However, in terms of energetics of the body, efficiency or more specifically, mechanical efficiency, is the relative preservation of energy in the form of work, during muscular effort. Our muscles use chemical energy and produce work and heat. Efficiency is calculated as the ratio of useful energy out to total energy in (work / energy cost) where both quantities are expressed in the same units (typically, joules). To express efficiency as a %, this unitless ratio is multiplied by 100.
You might ask, so how efficient are our skeletal muscles? The answer is… “that depends”. The answer depends entirely on the amount of work being done. During an isometric contraction, no work is done, so efficiency is zero. Similarly, if you can contract your muscles and allow shortening with zero force, no work would be accomplished and efficiency would be zero. So , between zero load and isometric force, work is generated and the muscles will have some efficiency. The magnitude of efficiency is closely related to the relationship between power and velocity of shortening. This is because force and velocity will determine the power of the relationship and the product of power and time is work.
The Force-Velocity Relationship and Power Output
As described in chapter 5, as the velocity of muscle shortening increases, the force that can be generated by a muscle decreases. This can be seen in Figure 6A.15 as the curvelinear fall in force as velocity of shortening increases. However, power output increases as velocity increases until a peak is reached, typically around one third of maximal velocity. This is also shown in Figure 6A.14. The energy cost of a muscle contraction also increases when shortening is allowed, but not as much as the power increases, so efficiency increases in proportion to the power output, reaching a maximal value at a velocity just less than the optimal velocity for power output. Beyond this velocity, the energy cost may continue to increase but the power output decreases so efficiency decreases.

The highest that muscular efficiency can be in converting chemical energy of fats and carbohydrates to work is ~30% (Stainsby 1982). Slow-twitch muscle is slightly more efficient while fast-twitch muscle is slightly less efficient at the maximal value. Efficiency depends on how much heat is released in converting the chemical energy of fats and carbohydrates to chemical energy in ATP. This efficiency is about 60%. Of the chemical energy preserved in ATP, about 50% of it can be released as work under ideal conditions (this would be at optimal velocity). Considering that the energy in ATP is already decreased relative to that which was available in the chemical substaratessubstrates, the overall efficiency is about 30% at the very best (0.6 X 0.5 = 0.3). When no work is done, the efficiency is zero and muscular efficiency can vary between zero and 30%. Considering that other body parts require energy (like the heart and ventilatory muscles) while exercise is going on, gross efficiency is never greater than about 25%, and some people cannot achieve greater than about 20%.
The maximum efficiency occurs when the power (work / time) is the highest it can be, or when velocity is about 1/3 of maximal velocity (this is dependent on curvature of the force-velocity relationship). Considering the difference in maximal velocity between fast-twitch and slow-twitch muscles, this relationship has a potential impact on efficiency of some physical activities (see Figure 6A.15). Cycling, for example is an activity for which the velocity of muscle shortening is dependent on pedallingpedaling frequency or cadence.
The Velocity Dependence of Efficiency
Considering the information presented in Figure 6A14, it can be seen that when the velocity is zero, or equal to maximal velocity, no work is done. For this reason, regardless of how many motor units are recruited, and how much energy is used, the efficiency (work/energy cost) must be zero. If only a small amount of work is done, then the efficiency will be very low. Only when the work or power is optimized will the efficiency approach 25%, and this depends on the motor unit recruitment required to accomplish the task. Motor unit recruitment depends on the fibre-type distribution in the muscles being activated. For example, cycling at 80 RPM and 200 watts, efficiency can vary from 16 to 24%. This efficiency is proportional to the proportion of type 1 muscle fibres in the vastus lateralis muscle, a primary muscle used in cycling (Coyle et al. 1992). It has been shown that at a given power output, efficiency varies with cadence (Sidossis et al. 1992). Cadence presumably affects velocity of shortening in the primary muscles contributing to the cycling exercise.
Cycle ergometry is a convenient way to quantify work and power and provides a stationary subject for measurement of VO2. For this reason, considerable research has been done, evaluating efficiency of cycling. It should be kept in mind that in measuring efficiency of cycling, the measurement of includes the energy cost of all body parts, not just that of active muscles. For this reason, we use the term “gross efficiency” when has been used to estimate the energy cost of exercise without baseline subtraction. In some cases, resting has been subracted to yield “net” energy cost giving net efficiency. For cycling exercise, where the exercise can be considered whole-body exercise, this practise has been challenged (Stainsby et al. 1980) because it is not known if the energy used at rest continues to be used during exercise at the same rate. The only time when subtraction of resting metabolic demand can be justifiably used to estimate efficienct is when the exercise under consideration involves a small muscle group. In that case, resting metabolic rate is relatively large and would mask the true efficiency of performing that exercise.
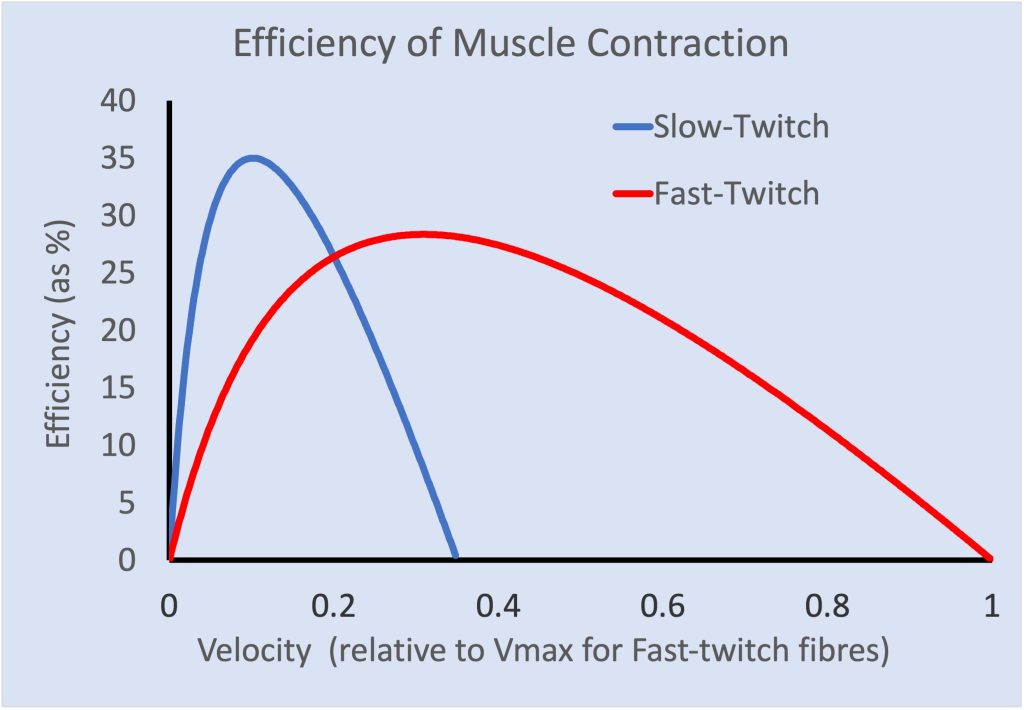
Economy of Locomotion is Dictated by Muscle Energetics
Economy of locomotion is defined as the energy cost of physically moving the body from one place to another by any means of locomotion (walking, running, skating, skiing, cycling…). The appropriate units are joules × kg-1 × km-1 when the form of locomotion is body mass dependent and joules × km-1 when the energy cost is not body mass dependent (like swimming and flat ground cycling). Here, we consider the economy of running and cycling to illustrate the fundamentals of economy of locomotion. To measure the energy cost of locomotion, we typically measure V̇O2 and V̇CO2 during steady-state exercise and estimate the energy equivalent of the gas exchange, based on an estimated mixture of fat and carbohydrate metabolized. This approach typically works reasonably well for intensities of exercise associated with a true steady-state of V̇O2. In some cases, studying higher intensities has been accomplished by measurement of lactate accumulation (O’Connell et al. 2017) or by extrapolation from lower intensities. There is also a large body of literature that has simply presented V̇O2 as an estimate of energy cost of locomotion, and this is reasonable when precision is not necessary. This estimate is referred to as oxygen cost. Any factor that has been identified as affecting oxygen uptake of locomotion probably still has an impact if energy cost is considered. Fletcher and colleagues (2009) identified that consideration of the substrates used during metabolism, using RER, affects the estimate of energy cost and much of the work published since then goes on to calculate the energy equivalent.
Economy of Running
The economy of running has been of interest for decades. The body of literature associated with this topic is quite large. A review of the energy cost of running (Fletcher and MacIntosh 2017) puts a lot of this work into perspective, and emphasizes that changes in economy relate strongly to the need to change motor unit recruitment. If the task requires additional motor unit recruitment, then it is likely that it will require more energy. In .contrast, if the locomotion can be done with less motor unit recruitment, the energy cost will be less.
As indicated above, economy of running should be expressed as joules · m-1 or joules · kg-1 · m-1. However, there is value in expressing running economy in Cal · kg-1 · km-1. Many people are interested in knowing how many Calories they have burned when they have run a given distance. It is convenient and reasonably accurate to estimate about 1 Cal · kg-1 · km-1. This equates to about 4.186 kJ · kg-1 · km-1.
There are several factors that will influence the economy of running including: stride length, stride frequency, body mass distribution, surface properties and wind. Figure 6A.16 provides an illustration of the complex nature of the factors that can influence economy of running.
Although some research has indicated sex differences for running economy, it seems unlikely that there are real differences (Fletcher Jared et al. 2013). Differences between males and females have been observed when running on a treadmill at 1% grade. This slight incline, which is imposed in an effort to compensate for lack of air resistance, tends to penalize heavier individuals, leading to the conclusion that males are less economic while running than are females. Running on a treadmill with zero slope yields no difference between males and females. There is more variability between individuals than between the sexes.
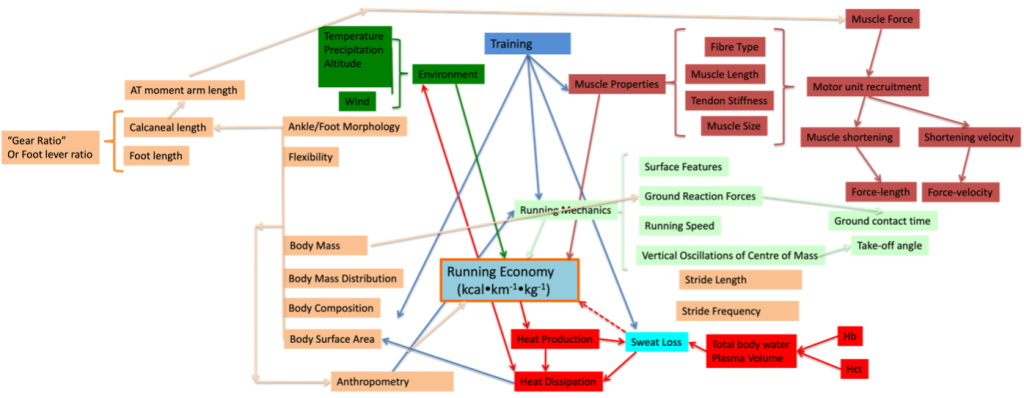
Cycling
Although cycling efficiency is a well researchedwell-researched topic, it seems that cycling economy has been largely ignored. In spite of this, many advances in cycling performance have been gained by improvements in economy. For example, the use of aerobars for triathletes provides a substantial advantage in reducing air resistance, reducing power output and improving economy by decreasing energy cost for going a given speed. The truth is that power output is the primary determinant of the energy cost of cycling and the faster you can move at a given power output, the better the performance will be. The following equation (MacIntosh et al. 2000) gives the power output for cycling on a level surface, and consideration of the variables in the equation yields important factors affecting economy of cycling.
Power = ½ Cd ·A ·(v-vair)2 · v +Cr · M · g
Cd is coefficient of drag, ai r resistance
A is frontal surface area
is air density
v is velocity of forward travel
vair is velocity of the wind where headwind would have a negative value
Cr is the coefficient of drag for rolling resistance
M is body mass
g is acceleration due to gravity (typically 9.81 m s-1 · s-1)
Consideration of this equation reveals three factors that can be adjusted to affect the energy cost of cycling. Frontal surface area can be minimized by bending at the hip and keeping the elbows close to the body. Cd can be minimized by bicycle design, wearing tight fitting clothing, aerodynamic helmet and cycling shoes (or covers). Rolling resistance can be minimized by keeping the tires well inflated and cycling on a smooth hard surface.
Cyclists today not only have speedometers that inform them of their speed, but options to have devices that inform them of their power output. Although these devices are typically used to record the workout while training, they can be used to provide feedback on ways to minimize power output while travelling at a given speed. By reducing the power output at a given speed, the rider can reduce the energy cost for cycling at that speed.
Summary
It is the energy use in muscles during exercise that necessitates the physiological responses of the body’s systems needed to maintain homeostasis. This energy is needed by the ATPases for ion pumping and molecular interactions of the muscles that generate force and accomplish mechanical work. The energy cost in a given muscle can increase nearly 100 fold during exercise. This increased energy need activates the metabolic anaerobic and aerobic pathways to regenerate ATP. ATP is regenerated by: phosphate transfer from creatine phosphate, glycolysis and oxidative metabolism. The use of creatine phosphate can be activated very quickly, and this increases creatine concentration in the myoplasm. A very small increase in [ADP] together with increased sarcoplasmic [Ca2+] activates glycolysis. Increased creatine concentration activates aerobic metabolism. Greater oxidative metabolism results in a need for increased delivery of O2 to the active muscles. Cardiac output increases and more oxygen is removed from the blood flowing through the active muscles. Ventilation increases to provide more oxygen to the blood and to allow more excretion of CO2. Heat is released in the muscles accompanying ATP hydrolysis and ATP production by glycolysis and phosphorylation. This heat must be removed from the body by the evaporation of sweat or by conduction and convection. Skin blood flow increases to bring the added heat close to the surface, necessitating a further increase in cardiac output.
The amount of energy needed by the muscles during exercise depends on how many muscles are active and the magnitude of activation of the active muscles. Factors such as speed of locomotion, force of contraction, supported body mass and power output contribute to the energy cost. Exercise in the mild intensity exercise domain can be sustained by oxidative metabolism and can be continued for hours. As exercise intensity increases, the duration that exercise can be sustained decreases. When the exercise elicits maximal oxygen update, the maximal duration of exercise is just a few minutes. When exercise requires all-out effort, the intensity can be maintained only for seconds. The energy cost of exercise can be quantified by measurement of oxygen uptake and lactate accumulation. Relating this energy cost to work accomplished permits calculation of efficiency. Economy of locomotion can be calculated with similar estimation of energy cost and relating this to the distance travelled by a given form of locomotion.
Research Highlight
The research presented in the article by O’Connell et al. (2017) illustrates how the energy cost of exercise in the severe intensity domain can be estimated, and provides an explanation for the slow component of . When intensity of exercise is above the anaerobic threshold, as is the case here, measurement of is not sufficient to allow calculation of the energy cost. Some of the energy at this intensity is provided by glycolysis, with accumulation of lactate. This research was done to address the question: is the slow rise in we call the slow component associated with constant or rising rate of lactate production. If the slow component was representative of a rising energy cost, as it most commonly is interpreted to be, then it would be expected that lactate production (accumulation) would continue at the same rate or a higher rate as the rose after 3 min of exercise at an intensity above the anaerobic threshold. Note that we define anaerobic threshold as the highest intensity of exercise that can be sustained with oxidative metabolism, so above the anaerobic threshold, lactate accumulation must occur.
The subjects in this study completed an incremental cycle ergometer test to determine lactate threshold and V̇O2max,. They then performed 3 constant intensity rides at 60% of the difference between anaerobic threshold and V̇O2max,. These rides, which were performed at approximately 88% of the power output at max were 3, 6 and 9 min in duration. At the end of the nine min trial, blood lactate was 13.9 mM, indicating a high level of exertion. Of interest, the accumulation of lactate from 3 to 6 min was 3.7 mM and from 6 to 9 min was 1.7 mM. This decrease in rate of accumulation was unexpected, and indicative that as rose, the energy yield from anaerobic glycolysis decreased. Taking into consideration the rising energy cost for ventilation, this decrease in energy yield from anaerobic glycolysis, the rise in associated with the slow component of did not represent an increase in energy cost of muscle contraction. Other than the small increase in energy cost for ventilation, the energy cost of the exercise remained constant through the 9 min of effort. In retrospect, this should have been expected, considering the slow time constant for the rise in for fast-twitch motor units. Figure 6A.17 illustrates this interpretation of the results of the study by O’Connell.
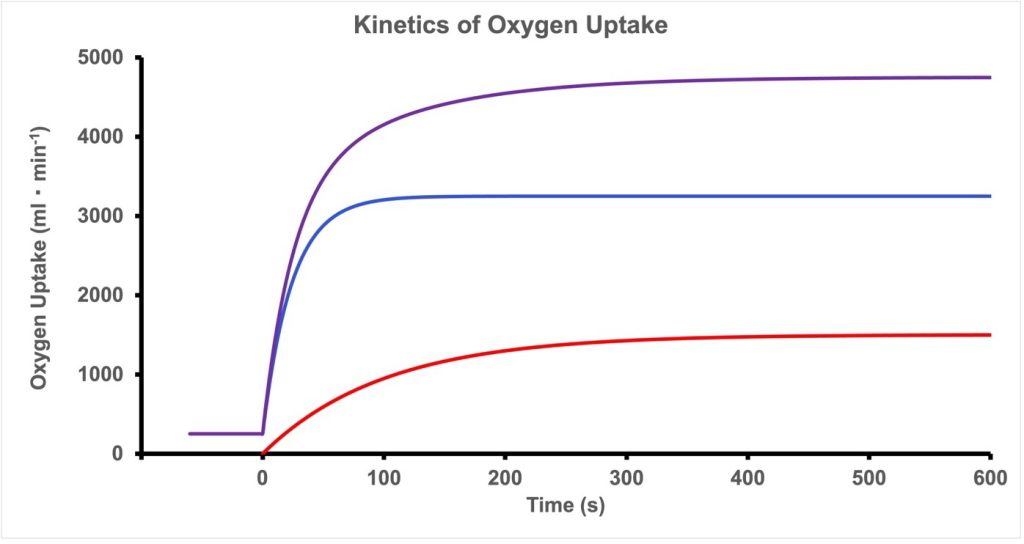
This figure shows the oxygen uptake on transition from rest to moderate domain exercise (blue line), the extra oxygen uptake in fast-twitch motor units (red line) for exercise in the severe intensity domain and the total oxygen uptake for this exercise (purple line). Note that the total oxygen uptake continues to rise after a steady state would otherwise be expected if only slow-twitch motor units were active. The slow component of slow component of oxygen uptake can be explained by the slow time constant for the kinetics of oxygen uptake in fast-twitch motor units. This would imply that the slow component would only be observed if fast-twitch motor units are required for the exercise.
Self-Assessment
Discussion Points:
Consider what is going on in the muscle fibres of an active motor unit and an inactive motor unit of the same muscle when exercise using that muscle is initiated.
Discuss the aerobic and anaerobic contributions during exercise in the mild, moderate, vigorous and hard intensity domains.
RQ and RER were explained in this chapter within the section titled “Substrate Use.” It was stated that when RQ = RER, total O2 and CO2 in the body would not change. Explain why the amount of O2 and CO2 in the body must not change for RQ = RER.
References
Baker, L.B. 2017. Sweating Rate and Sweat Sodium Concentration in Athletes: A Review of Methodology and Intra/Interindividual Variability. Sports Medicine 47(1): 111-128. doi:10.1007/s40279-017-0691-5.
Bergman, B.C., Wolfel, E.E., Butterfield, G.E., Lopaschuk, G.D., Casazza, G.A., Horning, M.A., et al. 1999. Active muscle and whole body lactate kinetics after endurance training in men. Journal of Applied Physiology 87(5): 1684-1696. Available from PM:10562610 [accessed.
Brooks, G.A., and Mercier, J. 1994. Balance of carbohydrate and lipid utilization during exercise: the “crossover” concept. Journal of Applied Physiology 76(6): 2253-2261.
Cade, R., Packer, D., Zauner, C., Kaufmann, D., Peterson, J., Mars, D., et al. 1992. Marathon running: physiological and chemical changes accompanying late-race functional deterioration. European Journal of Applied Physiology & Occupational Physiology 65: 485-491.
Coyle, E.F., Sidossis, L.S., Horowitz, J.F., and Beltz, J.D. 1992. Cycling efficiency is related to the percentage of Type I muscle fibers. Medicine and Science in Sports and Exercise 24(7): 782-788.
Crow, M.T., and Kushmerick, M.J. 1982. Chemical energetics of slow- and fast-twitch muscles of the mouse. Journal of General Physiology 79: 147-166.
Dashty, M. 2013. A quick look at biochemistry: Carbohydrate metabolism. Clinical Biochemistry 46(15): 1339-1352. doi:https://doi.org/10.1016/j.clinbiochem.2013.04.027.
DeLorey, D.S., Kowalchuk, J.M., and Paterson, D.H. 2004. Effect of age on O(2) uptake kinetics and the adaptation of muscle deoxygenation at the onset of moderate-intensity cycling exercise. Journal of Applied Physiology 97(1): 165-172. Available from PM:15003999 [accessed.
Drake, J.P., Finke, A., and Ferguson, R.A. 2024. Modelling human endurance: power laws vs critical power. European Journal of Applied Physiology 124(2): 507-526. doi:10.1007/s00421-023-05274-5.
Edman, K.A.P., and Mattiazzi, A.R. 1981. Effects of fatigue and altered pH on isometric force and velocity of shortening at zero load in frog muscle fibres. Journal of Muscle Research and Cell Motility 2: 321-334.
Fletcher Jared, R., Pfister Ted, R., and MacIntosh Brian, R. 2013. Energy cost of running and Achilles tendon stiffness in man and woman trained runners. Physiological Reports 1(7): e00178. doi:10.1002/phy2.178.
Fletcher, J.R., and MacIntosh, B.R. 2017. Running Economy from a Muscle Energetics Perspective. Frontiers in Physiology 8: 433. Available from http://journal.frontiersin.org/article/10.3389/fphys.2017.00433
https://www.ncbi.nlm.nih.gov/pmc/articles/PMC5479897/pdf/fphys-08-00433.pdf [accessed.
Fletcher, J.R., Esau, S.P., and MacIntosh, B.R. 2009. Economy of running: beyond the measurement of oxygen uptake. Journal of Applied Physiology 107(6): 1918-1922. doi:10.1152/japplphysiol.00307.2009.
Gaesser, G.A., and Brooks, G.A. 1975. Muscular efficiency during steady-rate exercise: effects of speed and work rate. Journal of Applied Physiology 38(6): 1132-1139. doi:10.1152/jappl.1975.38.6.1132.
Gaesser, G.A., and Brooks, G.A. 1984. Metabolic bases of excess post-exercise oxygen consumption: a review. Medicine & Science in Sports & Exercise 16(1). Available from https://journals.lww.com/acsm-msse/fulltext/1984/01000/metabolic_bases_of_excess_post_exercise_oxygen.8.aspx [accessed.
Gladden, L.B., MacIntosh, B.R., and Stainsby, W.N. 1978. O2 uptake and devleoped tension during and after fatigue, curare block and ischemia. Journal of Applied Physiology 45(5): 751-755.
Grassi, B., Rossiter, H.B., and Zoladz, J.A. 2015. Skeletal Muscle Fatigue and Decreased Efficiency: two sides of the same coin. Exercise and Sport Sciences Reviews 43(2): 75-83. doi:10.1249/JES.0000000000000043.
Grey, T.M., Spencer, M.D., Belfry, G.R., Kowalchuk, J.M., Paterson, D.H., and Murias, J.M. 2015. Effects of Age and Long-Term Endurance Training on V·O2 Kinetics. Medicine & Science in Sports & Exercise 47(2). Available from https://journals.lww.com/acsm-msse/fulltext/2015/02000/effects_of_age_and_long_term_endurance_training_on.10.aspx [accessed.
Hargreaves, M., and Spriet, L.L. 2020. Skeletal muscle energy metabolism during exercise. Nature Metabolism 2(9): 817-828. doi:10.1038/s42255-020-0251-4.
Hill, A.V. 1938. The heat of shortening and the dynamic constants of muscle. Proceedings of the Royal Society of London.Series B: Biological Sciences 126: 136-195.
Hill, D.W. 1993. The power concept: a review. Sports Medicine 16(4): 237-254. Available from https://link.springer.com/article/10.2165%2F00007256-199316040-00003 [accessed.
Jensen-Urstad, M., Svedenhag, J., and Sahlin, K. 1994. Effect of muscle mass on lactate formation during exercise in humans. European Journal of Applied Physiology and Occupational Physiology 69(3): 189-195. doi:10.1007/bf01094787.
Kindig, C.A., Howlett, R.A., Stary, C.M., Walsh, B., and Hogan, M.C. 2005. Effects of acute kinase inhibition on metabolism and tension development in isolated single myocytes. J Appl.Physiol 98(2): 541-549. Available from PM:15333609 [accessed.
MacDougall, K.B., and MacIntosh, B.R. 2024. Efficiency of cycling exercise: Understanding the physiology. The Journal of Physiology 602(14): 3593-3596. doi:https://doi.org/10.1113/JP287016.
MacDougall, K.B., Falconer, T.M., and MacIntosh, B.R. 2022. Efficiency of cycling exercise: Quantification, mechanisms, and misunderstandings. Scandinavian Journal of Medicine & Science in Sports 32(6): 951-970. doi:https://doi.org/10.1111/sms.14149.
MacIntosh, B.R., and Holash, R.J. 2000. Power output and force-velocity properties of muscle. In Biomechanics and Biology of Movement. Edited by B.M. Nigg, B.R. MacIntosh, and J. Mester. Human Kinetics, Champaign, IL. pp. 193-210.
MacIntosh, B.R., Neptune, R.R., and Van den Bogert, A.J. 2000. Intensity of cycling and cycle ergometry: power output and energy cost. In Biomechanics and Biology of Movement. Edited by B.M. Nigg, B.R. MacIntosh, and J. Mester. Human Kinetics, Champaign, IL. pp. 129-148.
MacIntosh, B.R., Holash, R.J., and Renaud, J.-M. 2012. Control of skeletal muscle contraction: muscle fatigue is a regulated response. J Cell Sci 125: 2105-2114.
Monod, H., and Scherrer, J. 1965. The work capacity of a synergistic muscular group. Ergonomics 8(3): 329-338.
Moritani, T., Nagata, A., DeVries, H.A., and Muro, M. 1981. Critical power as a measure of physical work capacity and anaerobic threshold. Ergonomics 24(5): 339-350.
Mourtzakis, M., Saltin, B., Graham, T., and Pilegaard, H. 2006. Carbohydrate metabolism during prolonged exercise and recovery: interactions between pyruvate dehydrogenase, fatty acids, and amino acids. Journal of Applied Physiology 100(6): 1822-1830. Available from http://jap.physiology.org/cgi/content/abstract/100/6/1822 [accessed.
O’Connell, J.M., Weir, J.M., and MacIntosh, B.R. 2017. Blood lactate accumulation decreases during the slow component of slow component of oxygen uptake without a decrease in muscular efficiency. Pflugers Arch 469: 1257-1265. doi:10.1007/s00424-017-1986-y.
Poole, D.C., Barstow, T.J., Gaesser, G.A., Willis, W.T., and Whipp, B.J. 1994. VO 2 slow component: Physiological and functional significance. Medicine and Science in Sports and Exercise 26(11): 1354-1358.
Poole, D.C., Schaffartzik, W., Knight, D.R., Derion, T., Kennedy, B., Guy, H.J., et al. 1991. Contribution of exercising legs to the slow component of slow component of oxygen uptake kinetics in humans. Journal of Applied Physiology 71: 1245-1253.
Richter, E.A., and Hargreaves, M. 2013. Exercise, GLUT4, and Skeletal Muscle Glucose Uptake. Physiological Reviews 93(3): 993-1017. doi:10.1152/physrev.00038.2012.
Romijn, J.A., Coyle, E.F., Sidossis, L.S., Gastaldelli, A., Horowitz, J.F., Endert, E., et al. 1993. Regulation of endogenous fat and carbohydrate metaoblism in relation to exercise intensity. Am J Physiol Endocrinol.Metab 265 (3): E380-E391.
Sidossis, L.S., Horowitz, J.F., and Coyle, E.F. 1992. Load and velocity of contraction influence gross and delta mechanical efficiency. International Journal of Sports Medicine 13(5): 407-411.
Stainsby, W.N. 1982. Energetic patterns of normally circulated mammalian muscle in situ. Federation Proceedings 41: 185-188.
Stainsby, W.N., Gladden, L.B., Barclay, J.K., and Wilson, B.A. 1980. Exercise efficiency: validity of base-line subtractions. Journal of Applied Physiology 48(3): 518-522.
Svedahl, K., and MacIntosh, B.R. 2003. Anaerobic threshold: the concept and methods of measurement. Canadian Journal of Applied Physiology 28(2): 299-323. doi:10.1139/h03-023.
Wasserman, K., Whipp, B.J., Koyal, S.N., and Beaver, W.L. 1973. Anaerobic threshold and respiratory gas exchange during exercise. Journal of Applied Physiology 35(2): 236-243.
Whipp, B.J., and Wasserman, K. 1972. Oxygen uptake kinetics for various intensities of constant-load work. Journal of Applied Physiology 33: 351-356.
Meet the Author
Dr. Brian MacIntosh obtained his undergraduate degree in Human Kinetics at the University of Guelph in 1975. He completed his PhD in 1979 at the University of Florida in Medical Sciences under the supervision of Dr. Wendell Stainsby. After a brief postdoctoral fellowship at Queens University in the Dept of Physiology, he held faculty positions at Concordia University (1980-1986), University of Saskatchewan (1986-1989) and the University of Calgary (1989-2019). He is now retired, but still pursuing research. During his career, Dr. MacIntosh published articles on a variety of topics: skeletal muscle contractile properties and fatigue, activity dependent potentiation, atrophy, running economy, critical power, slow component of oxygen uptake, force-velocity properties and power output.
