
Chapter 9: Homeostasis And its Disturbance During Exercise
Michael Lindinger

Learning Objectives
After reading this Chapter, you will:
- Explain how the integrated responses amongst physiological systems deal with challenges to homeostasis
- Describe the nature of water and electrolyte imbalances that can occur during exercise
- Describe the basic thermoregulatory responses to exercise, and how this affects body fluid balance
- Describe the basic concepts describing acid-base regulation in blood and muscle during exercise.
Key Terms
acid-base balance, acid-base state, dehydration, diuresis, electrolyte balance, euhydration, fluid balance, heat balance, heat strain, heat stress, homeostasis, osmolality, strong-ion difference, thermoregulation, ventilation
Introduction of Homeostasis and the Challenge of Exercise
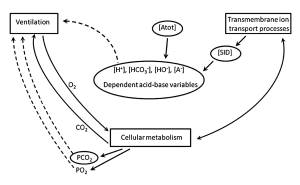
The purpose of this chapter is to describe and discuss three interdependent aspects of exercise that pose physiological challenges to maintaining homeostasis. These are thermoregulation, fluid / electrolyte regulation and acid-base regulation. The relationships between these may not be readily evident, so by way of introduction let us consider Figure 9-1. Thermoregulation, the ability to regulate core body temperature involves integrating the inputs from many physiological systems that participate in heat generation, heat sensing, heat flow, and heat dissipation. The most effective way to dissipate heat during periods of heat stress, i.e. exercise, is through sweating. There is a strong relationship between fluid / electrolyte balance and thermal stress during periods of moderate to vigorous intensity exercise because the need to cool the body is achieved in large part through increased sweating rates. Our sweat is dilute compared to the electrolyte composition of our body fluids, so prolonged sweating with inadequate fluid and electrolyte intake can lead to life threatening imbalances. Exercise also results in disturbance of acid-base balance arising from electrolyte imbalances, dehydration, metabolic CO2 production (and lactate accumulation at higher exercise intensities), and ventilatory CO2 elimination. Therefore exercise, whether prolonged, low intensity, or short-term high intensity, results in regulatory responses to mitigate thermal stress, dehydration and electrolyte imbalance, and acid-base imbalance. We will examine some of these physiological responses to low- and high-intensity exercise and discuss strategies for optimizing health and well-being during exercise.
This chapter will first consider challenges to fluid / electrolyte balance, and this will directly lead to a description and discussion of thermoregulation during exercise. The final section of the chapter will be on challenges to acid-base balance, with foci on short-term high intensity exercise and long-term exercise with dehydration / water imbalance.

———
Case Presentation: Hyponatremia in an Ultradistance Event
An ultradistance event, for runners, is one in which the distance is greater than the marathon (42 km) and, in Canada, these are typically called ultramarathons. Canada boasts the 430 mile (692 km) Yukon Arctic Ultra that is organized in February of even-numbered years. Runners, mountain bikers and cross-country skiers traverse from Whitehorse to Dawson City along the route of the Yukon Quest trail, the same trail taken by participants of the world’s toughest sled dog race. Most ultradistance events are of much shorter distances and occur under relatively mild ambient conditions of temperature and humidity. Regardless of the distance and the environment, one of the key challenges of ultra-events is to be able to maintain fluid and electrolyte balance within the body. Even when running in cold conditions, sweating can occur at high rates and can lead to pronounced and life-threatening dehydration.
Endurance based events can occur in a variety of environments, as such, it is important to understand the unique physiological demands experienced in different environments. Whether it is the Yukon in February or a desert in July.
Blake Jacque (BJ) Shellaque has decided that he will run an 80 km ultramarathon. The event is being held in April in central Ontario. In order to prepare himself for the sweat losses of fluid that will occur during the first 16 km, BJ consumed 1 litre of water during the 2-hour period prior to the start of the race. He had to urinate prior to race start, and then is ready to go. There are drink stations set up at 5 km intervals where cups of water and Gatorade® are handed out to the runners as they pass by. BJ knows that it is important to maintain hydration during this event. The ambient temperature ranges from 14 to 21C (relatively humidity ~60%) and he is maintaining a steady rate of sweating of about 1.5 L per hour. BJ manages to consume adequate amounts of fluids along the way but he drinks water because he does not know about the benefits of drinking an electrolyte supplement. By 4 hours into the run, at about the 50 km mark, BJ has consumed a total of 5 litres of water, which replaces 83% of the fluid lost through sweating (6 L). At this time, BJ experiences some lightheadedness and mild nausea. He is thinking that if he does not start feeling better soon, that he is going to have to stop. He keeps going for a short distance but is feeling bloated and tired and starts to get some muscle cramping. He stops and, because of his condition, receives medical attention within minutes.
Let us examine what has happened. The level of dehydration itself was not pronounced, and certainly not life threatening. However, consider the effect of the water that was imbibed prior to the race and during the 4 hours of exercise. When water is consumed, without electrolytes, then dilution of fluid compartments will occur and can create complications that may be just as profound as dehydration. The kidneys respond to the lowered plasma [Na+] and osmolarity by increasing the excretion of water, but can only accomplish this by also excreting ions. This results in an ongoing loss of electrolytes with the ‘excess’ water.
- Drinking water
- dilution of body fluids
- impaired cellular function
- increased renal excretion of water with ions.
Hyponatremia, or low plasma sodium concentration ([Na+]), is a pathophysiological condition that results from dilution of body fluids. The normal range for plasma [Na+] is 135 – 145 mmolL-1. The condition is caused, usually, from drinking water that is devoid of, or very low in, sodium. Putting this information into the context of ultradistance running, it should be evident that drinking water during such events can lead to hyponatremia. BJ’s total body water in the euhydrated condition before the race was 40 L, with 1/3 of this present as extracellular fluid (13 L), of which 1/5 (2.7 L) is plasma. BJ lost 6 L of fluid through sweating and an additional 1 L as urine for a total of 7 L (Table 9-1). Six liters of this fluid was replaced by drinking water, leaving a deficit of 1 L and a TBW (Total Body Water) of 39 L. Also, the 6 L of water that was consumed essentially diluted 33 L of body fluid (40 L TBW – 7 L sweat and urine). Assuming that 1/3 of the water (2 L) remained in the extracellular fluid compartment (ECF), which is presently 12.5 L, then pure water diluted ECF by about 16% (2 L / 12.7 L). With consideration that sweat is a dilute filtrate of plasma, then ion concentrations in plasma should have decreased by ~10%) lowering plasma [Na+] from 140 mmol · L-1 to 126 mmol · L-1. This low level of Na+ is life-threatening, and treatment requires immediate electrolyte therapy. Without treatment, the diuresis resulting from decreased plasma [Na+] and the corresponding low plasma osmolality will cause the loss of 2 L of urine, which partially restores plasma [Na+] (Table 9-1).
| Time | Volume of drink consumed
(L) |
TBW (L) | ECFV (L) | PV (L) | Sweating rate (L×h-1) | Sweat + urine fluid loss (L) | Plasma [Na+] (mmol×L-1) |
|---|---|---|---|---|---|---|---|
| Before start
|
1.0 | 40 | 13 | 2.7 | 0.1 | 0 | 140 |
| 1 to 4 h
|
+5.0 | 1.5 | |||||
| At 4 h
|
5.0 total | 39 | 12.7 | 2.5 | 1.5 | 6 + 1 | 126 |
| At 1 h of ‘recovery’
|
37 | 12.0 | 2.4 | 0.5 | Diuresis of 2 L | 133 |
Excessive intake of water results in dilution of body fluids and the life-threatening condition known as hyponatremia (natrium is Latin for sodium, and hypo mean low). Clinically, hyponatremia is defined as having a plasma [Na+] of less than 135 mmoles · L-1. Because hyponatremia represents a dilution of body fluids, other ion imbalances within extracellular fluid and intracellular fluid (ICF) are also often present. Mental signs of hyponatremia include headache, irritability, general fatigue, confusion, hallucination and in severe conditions loss of consciousness and coma. Other signs include nausea, vomiting, muscle weakness, muscle spasms and cramps (Siegel et al. 2008). In contrast, in adequate intake of fluids, or excessive intake of electrolyte solutions, results in elevated concentrations of ions in body fluids, and these also result in performance and health detriments (Siegel et al. 2008). It is clear that optimizing health and performance during prolonged activities requires careful consideration of fluid ingestion.
Take Home Message
The only way to maintain hydration is to maintain an adequate and balanced intake of electrolytes with water. This is why beverages such as Gatorade® were developed and are effective.
Fluid Balance
As noted in the endurance running example described above, fluid balance is important for performance and for thermoregulation (see below). Fluid balance, through its effects on the concentrations of ions, proteins, and metabolites in plasma and body fluids, is also an important contributor to acid-base balance – this will be discussed in the final section. In order to appreciate the demands of exercise on fluid balance, we also need to understand fluid needs in the individual at rest.
When a body is euhydrated it is in a state of ideal fluid balance such that there are no deficits (dehydration) in any fluid compartments, and also no excesses of fluid or electrolyte that would result in increased urine production. When we are in fluid balance the oral ingestion of fluid and electrolytes meets the losses occurring through the feces (~5%), respiratory tract (~10%), the skin (~50%), and the kidneys (~35%). Healthy men and women at rest need to consume 3.7 L and 2.7 L, respectively, of water daily in order to meet these losses (Sawka et al., 2005). An appreciable amount of this water is consumed in the foods that we eat, while the remainder is consumed in various beverages. Sweat losses can approach 2 L per day for individuals at rest in hot, humid environments, although a sweat rate of 5 L per hour has been reported for an individual exposed to hot conditions. This can only be achieved when skin blood flow is maximal and not in competition for blood flow to muscles.
Increases in activity resulting in increases in core temperature result in proportionate increases in sweating and respiratory fluid losses. Respiratory fluid losses are increased as a result of the increased depth (tidal volume) and frequency of breathing. Sweating fluid losses during activity are much higher than those occurring from the respiratory tract. High levels of activity can increase sweat losses by more than 4 L per day, such that total fluid losses may be 6 L per day or higher. Typical sweat rates during moderate intensity exercise are 1 – 2 L per hour, and these sweat rates can be sustained only as long as individuals do not lose too much fluid, i.e. there is ongoing rehydration.
The highest recorded sweat rate during exercise is 3.7 L per hour, reported for Roberto Salazar when training for the 1984 Olympics. Sweat rates greater than 3 L per hour can only be sustained for over an hour when hydration is maintained through consumption of electrolyte-containing beverages (Sherriffs et al., 2007). It is very difficult to consume more than 2 L of fluids per hour during exercise. Therefore, when sweat rates are very high it is clearly not possible to drink fluids at a high enough rate to prevent dehydration from occurring. Therefore, strategies have been developed and used that minimize dehydration and its negative effects on performance, thermoregulation, and health.
A number of strategies are used to try to maintain hydration during exercise. These include achieving euhydration prior to the start of exercise and during exercise to ensure adequate intake of water, electrolyte solutions, or sports gels. Gels are increasingly being used by athletes because they are less bulky and provide electrolytes and energy; however, caution must be used with these because adequate water ingestion is required to provide the needed balance between ingested electrolytes and water.
Another strategy is to try to hyperhydrate prior to exercise by ingesting compounds that will ‘hold’ water within the body for some time; glycerol has been used and well-studied in this regard. Hyperhydration using glycerol or any compound must be performed carefully, and for novices should be tried at lower loading amounts than recommend. Inappropriate use can lead to headaches, blurred vision, and gastro-intestinal upset. When using glycerol, 1 to 1.5 grams of glycerol per kg body weight is mixed into 25 mlkg-1 body weight of water, and this should be consumed over a 1-hour period 60-90 minutes before starting exercise (Robergs, 1998). For a 70 kg person, this equates to 70 – 105 g of glycerol in 1.75 L of water (or electrolyte solution). While some of this fluid will be rapidly lost through the kidneys, total body water will be increased by about 500 ml, which may benefit cardiovascular function, skin and muscle blood flow during exercise, and skin blood flow to meet needs for thermoregulatory sweating.
Composition of Effective Rehydration Solutions
Electrolyte concentrations in human sweat are much lower than those of the body fluids (Table 9-2). This is because the fluid excreted into the sweat gland is altered by the selective reabsorption of Na+ and Cl– by active ion transport process by cells within the tubular epithelium. The human eccrine sweat gland has evolved as a means of retaining valuable salts within the body (Baker and Jeukendrup, 2014). The composition of effective electrolyte solutions for ingestion during and following exercise can thus be estimated from the composition of sweat.
|
|
Plasma |
Sweat[1] |
Sports drinks[2] |
|---|---|---|---|
|
Carbohydrate (g · L-1)
|
0.7 – 1.5 |
|
60 – 80 |
|
Sodium (Na+, mmol · L-1)
|
136 – 145 |
7 – 96 |
10 – 35 |
|
Potassium (K+, mmol · L-1)
|
3.5 – 5.0 |
3 – 8 |
3 – 5 |
|
Calcium (Ca2+, mmol · L-1)
|
2.2 – 2.6 |
0.2 – 0.5 |
0 – 2 |
|
Magnesium (Mg2+, mmol ·L-1)
|
1.5 – 2.4 |
0.04 – 0.1 |
0 – 2 |
|
Chloride (Cl–, mmol ·L-1)
|
98 – 106 |
7 – 91 |
10 – 12 |
|
Osmolality (mOsm · kg-1)
|
275 – 295 |
100 – 200 |
280 – 380 |
1 Data from Lara et al., 2016; Ely et al., 2013; Baker et al., 2011
2 Data from Baker and Jeukendrup, 2014; Proactive Nutrition (proactivenutrition.net)
In the 1960s, researchers and staff working with the University of Florida Gators football team developed the first recognized electrolyte solution for fluid replacement during exercise, Gatorade®. This was necessary because the high sweat rates occurring in individuals working at moderate to high intensities while wearing protective football equipment for extended durations in hot and often humid conditions, resulted in numerous cases of heat strain. Heat strain occurs when mechanisms for dealing with heat stress are exceeded, and in the extreme can result in catastrophic failure of thermoregulation, renal function, and death.
Because sweat is relatively dilute compared to body fluids, a consequence of sweating dehydration is an increase in the concentrations of Na+, Cl–, other ions, and proteins in the plasma and extracellular fluid (ECF). This feature of human ion regulation results in increased plasma osmolality, which serves as an important stimulus to the thirst mechanism. The concentrating effect of sweating on plasma/ECF ion concentrations can be countered by drinking water in adequate amounts to restore ion balance. However, because ion losses occur with sweating, ingesting sufficient water to restore plasma/ECF ion balance will not fully rehydrate the individual. The only way to effectively accomplish this would be by also taking in adequate amounts of electrolytes to replace those lost in sweat.
The types of fluids ingested for the purpose of maintaining hydration and optimizing water and ion concentrations in the body has received much study in the past 50 years. Because the main electrolytes lost in sweat are Na+ and Cl–, these are the main electrolytes found in effective oral electrolyte solutions (Proactive Nutrition, 2018). There should also be appropriate amounts of K+, Ca2+, and Mg2+. In order to accommodate taste and gastrointestinal (GI) function, the osmolality of the solution is typically about half that of body fluids (i.e. ~150 mOsmol · L-1), contains some dextrose to enhance intestinal absorption of water and electrolytes, as well as flavouring agents. Ideally, small amounts (~250 ml) should be consumed frequently (15 to 30-minute intervals prior to the start of exercise) during exercise and during the immediate post-exercise recovery period.
The presence of electrolytes in post-exercise rehydration beverages is very important for effectively restoring hydration. In 1994, Maughan and coworkers studied the effects of electrolytes in the recovery period after exercise. Subjects underwent dehydration by 1.8% of body mass with intermittent cycle ergometry. Between 30 and 60 minutes after exercise, subjects drank 1 of 4 solutions at a volume equal to the body water loss. Solution A, comprising 90 mmol ·L-1 glucose only (no electrolytes), resulted in increased urine output and a net negative fluid balance (still dehydrated) the following morning. Therefore, the ingested volume effectively diluted the concentrations of ions in the blood and body fluids, which was sensed by the body as a volume overload, although the volume was equal to that lost. The kidneys respond to this signal by increasing the excretion of water, which can only be accomplished by reduced tubular reabsorption of ions. The result is that there is no effective rehydration and that dehydration could, in fact, worsen. In this recovery ‘rehydration’ study, there were no differences among the three other solutions with respect to urine production and fluid balance. As expected, recovery of Na+ balance was enhanced when Na+ was present in the solution, and recovery of K+ balance was better with K+ containing beverages. Additionally. the presence of Cl– in the solution improved the recovery of cation balance. It can be concluded from studies such as this that it is important that the electrolytes present in rehydration solutions are physiologically balanced to meet the needs for optimal fluid recovery.
Summary
Prolonged exercise heat stress results in loss of water and electrolyte through sweating. Sweat rates of 1.5 L · h-1 are normal and can be twice as high in acclimated athletes. Prolonged sweating, without fluid supplementation, will result in life-threatening dehydration and electrolyte imbalance. Replacing sweat losses with only water results in a dilution of body fluids, which can make the electrolyte imbalance worse and which will result in a diuresis to try to restore plasma [Na+] and osmolality. Replacing sweat losses with well-designed electrolyte solutions, consumed at a rate to match sweat rate, will prevent dehydration and electrolyte balance, and enhance exercise performance and ability to thermoregulate.
Exercise Heat Stress Results in Dehydration to Meet the Needs of Thermoregulatory Cooling
The efficiency of muscular contraction, expressed as the conversion of chemical energy to the mechanical energy of locomotion, ranges from 0-25%, but for cycling is typically 16-23% (Coyle, et al. 1992). The chemical energy refers to those compounds (e.g. free fatty acids, glucose, amino acids) that cells can metabolize, thus liberating energy from the bonds between atoms. Most of the chemical energy that cannot be used for generating ATP is released as heat (refer back to Figure 9.1). It is essential that heat is removed from muscle as rapidly as possible during periods of contraction because temperatures above 43ºC result in conformational changes in muscle proteins (i.e. some proteins start to denature or cook). At 42ºC, mitochondrial uncoupling occurs, resulting in O2 uptake without corresponding rephosphorylation of ADP (Jarmuszkiewicz et al., 2015). This uncoupling will further increase heat production. The most important means of removing heat from muscle is by convective flow of blood. This is accomplished by maintaining a high rate of blood flow through the muscles – this is one key demand for the increased cardiac output required during exercise. Blood perfusing contracting muscles is transported initially to the lungs and skin where heat dissipation can occur. Heat is also transferred via blood to all tissues of the body, resulting in an increase in body heat storage which results in an increase in core body temperature.
Exercise heat production and storage → thermoregulatory cooling → increased sweating → fluid loss from all compartments → dehydration.
—–
Case Presentation: Heat Stress in a Distance Event
Our budding athlete, BJ, has learned an important lesson and uses electrolyte solutions when training and competing so as to avoid electrolyte imbalance and dehydration. He has entered into a half-marathon race in early May. Training conditions through April and early May were relatively cool, with the highest ambient temperatures at 20°C. From training in these conditions he has learned that his sweating rate is about 1.5 L per hour, at a running speed of 12 km · h-1, and he now religiously consumes 1.5 L of Gatorade® during each hour of running.
Race day morning weather conditions are very fine and temperatures are predicted to reach 25°C during the race, with relative humidity (RH) pushing 80%. BJ is thinking “nice – I’m going to have a great run today”. Temperature at the start of the race is 21°C, and with the excitement of the start, BJ goes out hard and his speed for the first 2 km is 13 km · h-1. He feels great, he feels that he is in for a good run, and he decides to maintain this pace. His legs are moving well, his breathing is good. What BJ is not appreciating, however, is that with the increased running speed he is also experiencing an increased rate of body heat storage. He pushes on, past 5 km, maintaining his intake of fluids. As he approaches 10 km he realizes that his breathing has become heavier than normal, and his breathing rate is faster than usual. He also notices that he seems to be sweatier. He attributes these physiological responses to increased running speed. He is on a personal best pace and he is highly motivated to continue at or close to this pace.
——————–
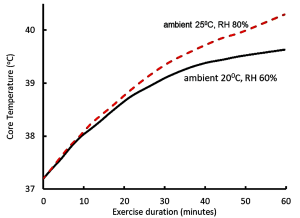
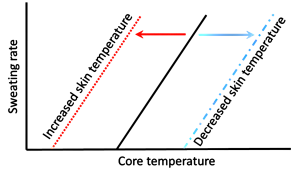
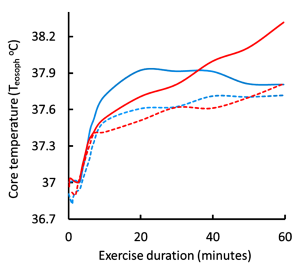
Let us now examine the physiological responses to running in warm (25°C and RH 80%) conditions, compared to ‘normal’ conditions (20°C and RH 60%). We have already learned that the increased running speed results in a more rapid generation of heat by contracting muscles, leading to an increased rate of body heat storage and core temperature rises (Figure 9-2). The body responds to the increase in core temperature (sensed by the hypothalamus) by increasing blood flow to the skin (convective and radiative cooling) and by increasing the rate of sweating in order to provide thermoregulatory cooling through evaporation of sweat. In general, sweat rate is directly proportional to core body temperature (Figure 9-3). When BJ was running in the warmer ambient conditions, both skin and core temperatures were greater than when he trained at cooler ambient conditions, resulting in a greater increase in core temperature and greater sweat rates. I think that now you can appreciate that BJ is headed for some physiological difficulties. If he tries to keep going at this pace, he will crash.
Muscle Contraction Generates Heat; Increases Sweating Rate and Reduces Blood Volume
Due to the increase in BJ’s core temperature his sweating rate has increased to 2 L·h-1, although fluid intake remains at 1.5 L·h-1. Respiratory rate has also increased, resulting in additional respiratory fluid loss of 0.5 L·h-1. The increased fluid loss during the first hour of the race is thus 1 L, with a significant part of this borne by the extracellular fluid (ECF) compartment, and so ECF volume is reduced from 13 L (at rest) to 12.3 L. Blood volume (2.6 L at rest) comprises about 20% of extracellular fluid volume and therefore blood volume is proportionately reduced (140 ml). Blood volume has also been reduced 5% (260 ml) due to a net osmotic transfer of fluid into contracting muscle that occurred with the rest to work transition, such that the total reduction in blood volume is presently 400 ml (15% of initial blood volume).
The reduction in blood volume means that the heart needs to work even harder to meet the demands of increased blood flow to contracting muscles, to the lungs, and to the skin. Cardiac output (Q̇) is the product of heart rate (HR) and SV, (the volume of blood pumped with each contraction of the left ventricle) and thus Q̇= HR SV. SV is indirectly proportional to blood volume (BV), therefore when BV is reduced by 15% then SV will similarly be reduced. Therefore the only way to maintain Q̇ is to increase HR, thus increasing the work of the heart. Now let us consider the demands for Q̇:
- increased Q̇ demanded by contracting muscles to provide oxygen and fuel and to remove heat the metabolic products such as CO2;
- increased Q̇ demanded by the skin for thermoregulatory cooling;
- increased blood flow to the lungs for gas and heat transfer.
Each of these three processes results in profound vasodilation of the vascular beds in these tissues, reflecting both the needs of the tissues and of the whole body.
Let us summarize:
- BJ decides to run faster.
- It is warmer outside.
- It is more humid outside.
- BJ’s core body temperature increases faster than usual.
- BJ’s sweating rate is greater than usual, and exceeds his rate of fluid replacement.
- His blood volume is reduced at a time when high Q̇ is needed to meet tissue and body needs for metabolism and cooling.
Is this a scenario for heat injury? We have not yet considered the impact of elevated relative humidity on the ability to dissipate heat. BJ does notice that he is more sweaty than usual, and attributes this to increased running speed, which is partially correct. The increased humidity has also significantly reduced the rate at which sweat can evaporate, and therefore more sweat is dripping off than evaporating. It is the evaporation that provides the cooling effect, so when humidity is high, evaporative cooling is diminished. This in turn reduces the ability to dissipate heat by the skin and contributes to the higher rate of body heat storage experienced by BJ, and this in turn increases the sweating rate. But this is not beneficial at this point.
- Heat dissipation is not adequate to match the rate of heat generation.
- Most of the sweat produced does not evaporate, sweating rate is increased, contributing to dehydration, loss of blood volume, and increase in HR.
At this point BJ knows that something is not right. He is not able to maintain the pace and slows down. There is some fairly immediate relief, but this is short lasting. Sweating rate remains high, core temperature and heart rate continue to increase. Heart rate is maximal, but no longer adequate to meet needs, and blood pressure drops. Then BJ stumbles, steps off the course onto the grass, falls to his knees and collapses.
- Heat syncope has occurred.
- BJ receives immediate medical attention, with fluid and cold therapy, and feels much better within an hour.
- Thermoregulation
The scenario with BJ described above provides an example of a number of disturbances to homeostasis that occur during prolonged, moderate intensity exercise. These include muscular heat production and whole body heat storage initiating the need for thermoregulatory cooling, the production and secretion of sweat that allows for evaporative cooling at the skin, increased demand for cardiac output to meet the need for increased blood flow to move heat from contracting muscles to the skin, resultant decreases in intracellular fluid volume, extracellular fluid volume, circulating blood volume, and total body water. These, in turn, further influence blood pressure and cardiovascular function. Attempts to limit the dehydration, by drinking only water, results in dilution of ion concentrations, which additionally affects functioning of all cells of the body.
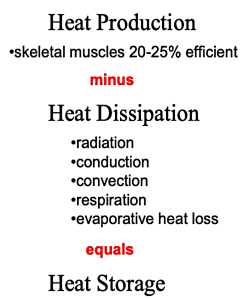
Thermoregulation refers to the mechanisms involved in the control of body and tissue temperatures. Figure 9-4 shows the reasons for the increase in body heat storage during exercise and the main ways in which heat can be dissipated. When body heat storage is increased, heat balance is maintained through various heat dissipation routes including evaporation of sweat, convective heat loss from the skin by movement of air, radiation of heat to the ambient environment (assuming air temperature is cooler than skin temperature), and conduction of heat to solid surfaces (usually minimal).
Body heat storage (S) can be calculated from measurements of core body temperature (Tcore), mean skin temperature (Tskin), boy mass (m) and height (h) using equation 9-1 (Tikuisis et al., 2001).
S (kJ) = 3.55 kJ · kg-1 ⋅Tb ⋅ BSA-1 equation 9-1
where Tb = 0.65 ⋅ Tcore + 0.35 ⋅ Tskin equation 9-1a
and BSA (cm2) = 128.1 ⋅ m0.44 · h0.60 for men equation 9-1b
BSA (cm2) = 147.4 ⋅ m0.4 · h0.55 for women equation 9-1c
where: kJ is kilojoules, kg is kilograms of body mass, BSA is body surface areaTb is the average body temperature, m is body mass, h is height.
Detecting Changes in Temperature
The body is endowed with thermal sensors at the hypothalamus and in the skin (Figure 9-5). The hypothalamus is a small multifunctional integrating organ in the mid-region of the brain. As warmed blood perfuses the hypothalamus, an increase in blood temperature is detected by temperature sensitive neurons. The hypothalamus controls skin blood flow and sweat production. Mild increases in blood temperature (e.g. less than 0.2ºC) have no effect on skin blood flow and sweating because there is a temperature setpoint or threshold that must be reached before signals are sent from the hypothalamus to the skin to change vascular resistance and initiate sweating. In most individuals an increase in circulating blood temperature of ~0.2C results in adequate stimulation of heat-sensitive neurons in the hypothalamus to initiate a sweating response.
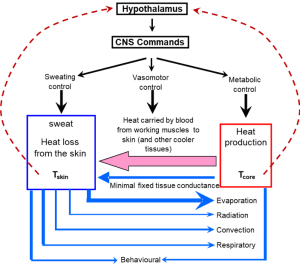
Heat Dissipating Mechanisms
The main ways that we can lose heat to the environment are sweating with evaporative cooling, convection of air over our body, radiation of heat into the environment, and conduction to solid surfaces (Figure 9-5). Heat loss through the respiratory system (combination of evaporation, radiation, and convection within the pulmonary system) can also be substantial in cool conditions with low relative humidity. Conduction and convection can also play important roles for heat transfer when the body is immersed in water because water has a greater heat capacity than air.
Respiratory heat loss
We lose heat from our bodies through the process of breathing. Not only do we warm up the air we inhale (to body temperature), we also fully saturate this inhaled air. The evaporative heat energy is lost from the body. When at rest and dressed appropriately, between ambient temperatures of -20 to 20ºC, ventilatory heat loss corresponds to about 25% of the whole-body metabolic rate. This magnitude of heat loss may be undesirable when in cool conditions for extended periods of time and could lead to a decrease in Tcore. In situations of heat stress (exercise, over-clothed, heat exposure) an increase in core temperature of about 1ºC is accompanied by an increase in breathing frequency without increase in tidal volume. This is called a thermal hyperpnea, thermal tachypnea or panting, and is similar (but much less obvious) to what is seen in dogs and other mammals during periods of thermal stress (White, 2006). With exercise, ventilatory heat loss as a fraction of metabolic rate diminishes, such that at work rates greater than 200 W the ventilatory heat loss represents about 15% of the metabolic rate (Cain et al., 1990). In conditions of Q̇ this represents a favorable loss of heat from the body. There are corresponding increases in heat loss through evaporative sweating and radiation as work rate increases.
When heat loss through non-ventilatory mechanisms is inadequate, thermal tachypnea may contribute to an acid-base imbalance termed a ‘respiratory alkalosis’ . Because the ventilatory system is important in gas exchange and acid-base regulation, thermal tachypnea will increase the rate of ventilatory CO2 elimination, thus lowering plasma PCO2 and [HCO3–] and raising [H+] (plasma alkalosis). At some point, peripheral and central chemoreceptors will be sensitive to the changes in plasma PCO2 and pH and decrease the drive to ventilate. Therefore, there can be a conflict in control of breathing with heat driving an increased breathing frequency and chemoreceptors driving a decreased breathing frequency (Kenny et al., 2014). The thermal effects on plasma ventilatory and acid-base variables are easily measured when someone is at rest. During exercise, however, it is difficult to separate the thermal effects on acid-base balance from those imposed by exercise.
Increased Skin Blood Flow, Sweating and Evaporative Heat Loss
Sweat production is required for evaporative cooling. This is recognized by the term evaporative requirement (Ereq), which is the sum of the metabolic heat production (H) and the radiative (R) and conductive/convective (C) heat exchanges (Brotherhood, 2008). Therefore, to achieve thermal balance and control of body temperature the net heat load arising from
H ±R ± C
must be balanced by evaporative cooling (E), such that
Ereq = H ± R ± C.
Note that Ereq only provides an estimate of sweat requirement; thermal balance can only be achieved if sufficient sweat is produced AND evaporated to meet Ereq. Any sweat dripping off the body cannot contribute to evaporative cooling. The rate of evaporation is also affected by the ambient humidity such that evaporation is reduced at high relative humidity. Also, the rate of heat transfer from the skin to the environment by convection and radiation depends on the temperature gradient between the skin and the environment. Heat transfer by radiation is a function of body surface area and remains constant with changes in core temperature and air speed. In contrast, heat transfer by convection increases as a function of increases in core temperature. Also, increasing air speed from 0.2 to 3.0 ms-1 doubles the rate of convective heat transfer.
Heat loss at the skin is dependent on the flow of blood to the skin – an increased blood flow during times of elevated Tcore moves heated blood to the skin to allow for heat transfer through tissues and also to provide the fluid required for sweating. The increase in blood flow to the skin is largely passive and results from cutaneous vasodilation and recruitment of capillaries – the latter two of which are under neural control. In order to maintain central blood pressure, the cutaneous vasodilation must be met by an increase in cardiac output. This need for increased skin blood flow is thus in competition with the need for cardiac output directed towards contracting muscles, particularly as the cardiac output approaches maximal levels. Thus, beyond this passive component, there is also a complementary neural drive to increase heart rate.
In 1977 Rowell and colleagues examined the relationship between skin temperature (Tskin), exercise, esophageal temperature (a measure of Tcore), and skin blood flow (Brengelmann et al., 1977). Subjects performed submaximal leg cycling exercise and when Tskin was elevated to 38ºC by means of water-perfused suits, there was a small transient increase in skin blood flow between 6 and 10 minutes, (measured as forearm blood flow, Figure 9-6).
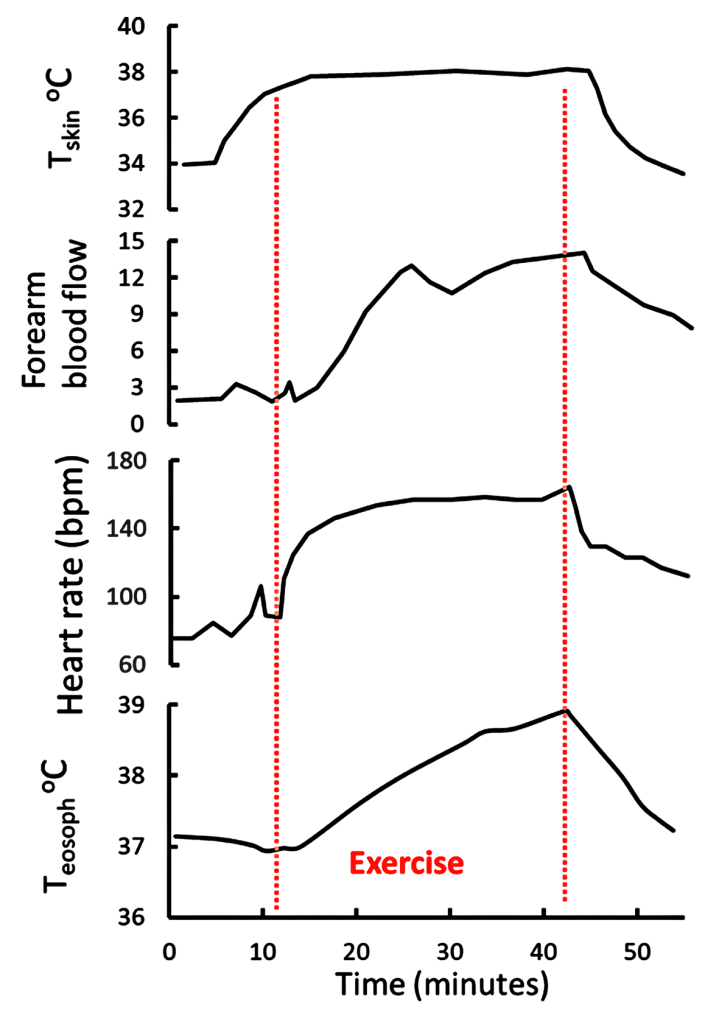
This indicates that thermal sensors in the skin responded by inducing a short-lasting vasodilation of the skin. The increase in blood flow was associated with the expected increase in heart rate between 6 and 12 minutes. Subjects then exercises at 86-147 W for 17-30 min while Tskin was held at 38ºC. Core temperature increased by 1ºC during the first 13 minutes of exercise, then continued to increase until 2 minutes after the end of the 30-minute exercise period. Heart rate had peaked 8 minutes into the exercise, however skin blood flow continued to increase for an additional 5 minutes, that is until 13 minutes of exercise. This indicates a loss of association between heart rate and skin blood flow after the initial increases. Also, the fact that skin blood flow did not increase after the initial 13 minutes of exercise, despite Tcore increasing by 2ºC over the exercise period, suggests that near-maximal vasodilation of the skin, and cutaneous thermoregulatory potential, occurs with relatively small increases in Tcore. This is beneficial for heat dissipation during even brief periods (less than 10 minutes) of submaximal intensity exercise.
Johnson and coworkers (1984) further demonstrated the relationships between Tcore, Tskin, skin blood flow, and sweat rate. They also used water-perfused suits to rapidly elevate Tskin during exercise. There was a small increase in sweat rate with the 0.5ºC increase in Tcore occurring at the onset of exercise. In contrast, gradually increasing Tskin by 4ºC during exercise resulted in early and pronounced increased in skin blood flow and sweat rate. The results are consistent with a dominant role for Tskin in the reflex regulation of both skin blood flow and sweat rate. This interplay between central (hypothalamic) and peripheral (skin) thermal sensors in thermoregulatory sweating is exemplified in Figure 9-3. Changes in Tskin alters the set point (threshold) at which sweating will occur. When the threshold is reached, sweat rate increases as a function of increases in Tcore.
In summary, increases in core and skin temperatures are involved in the regulation of skin blood flow and sweat rate. However, increases in Tskin appear to play the dominant role in regulating blood flow and sweat rate.
Heat Loss by Radiation, Conduction, and Convection
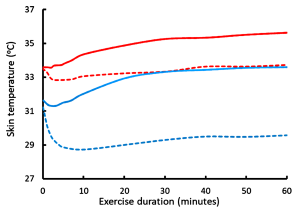
We will now consider the minor routes of heat loss by radiation of heat from surfaces, conduction between masses, and convective cooling by the movement of air over the skin. Adams and coworkers (1992) studied the cooling effects of convective air movement (wind) over the body’s surface at ambient temperatures of 24ºC and 35ºC during submaximal leg cycling exercise. Increasing air speed from 0.7 to 10.8 km·h-1 resulted in a significant reduction in sweat loss at both ambient temperatures, but without change in sweat evaporative rate at the lower temperature. Therefore, increased air speed reduces sweat rate, an effect mediated in part by a reduction in skin temperature (see above). At the higher temperature, sweat evaporative rate was increased only during the first 30 minutes and this resulted in a 20% reduction in sweat rate at the higher temperature (i.e. evaporative cooling of the skin resulted in a reduced rate of sweating). Convective heat loss was minimal at the higher temperature at both air speeds. When exercise was performed at 24ºC increased air speed rapidly decreased Tskin (Figure 9-7) and augmented convective heat loss by 20% compared to still air. However, contrary to what might be expected, increasing air speed from 0.7 to 10.8 km · h-1 actually increased the rate of body heat storage during the first 30 minutes of exercise (Figure 9-8) and reduced the rate of evaporative heat loss. This occurred because the decrease in Tskin that occurred with air speed 10.8 km · h-1 at ambient T of 24ºC (Figure 9-7) resulted in increased heat transfer coefficients and a reduced skin-to-ambient temperature gradient. In contrast, when exercise was performed at 35ºC, the increased air speed resulted in a decreased rate of heat storage and increased rates of evaporative sweating and evaporative heat loss, which enhanced skin dryness. At 35ºC, because of the very small difference between air and body temperature, convective and radiative heat loss was minimal. The decreased rate of heat storage during exercise indicates a significant convective heat loss. Taken over the 60-minute exercise duration of this experiment the main heat exchange values were as follows, using the formula:
S = (M – W) – E + R + C equation 9-2
where S is heat storage, M is metabolic free energy production, W is work, E represents whole body evaporative heat loss, R is the radiation heat exchange, and C represents the convective heat exchange, with heat exchange unit of W⋅m–2.
24ºC with air speed 0.7 km · h-1
35 = (345) – 210 – 46 – 52
24ºC with air speed 10.8 km · h-1
21 = (345) – 196 – 24 – 65
35ºC with air speed 0.7 km · h-1
53 = (345) – 306 – 1 – 1
35ºC with air speed 9.8 km · h-1
29 = (345) – 352 + 7 + 20
While the differences in convective heat loss may appear small, when exercise is prolonged then the increase in air velocity is positively and linearly correlated with the exercise time to exhaustion (Figure 9-9). Increasing the air speed to 30 km · h-1 resulted in a doubling of exercise time to exhaustion (Otani et al., 2018).

Heat Stress and Heat Injury
Our budding athlete BJ has experienced excess whole body heat storage which has resulted in heat syncope. Heat syncope is dizziness or fainting as a result of overheating. It is relatively mild on the continuum of heat injuries. As heat storage increases in the body, specific terms are used to describe the status of the body’s response: heat stress, heat strain, heat injury, and heat stroke. Let us consider what is normal as well as what is abnormal and dangerous. Recall from above it was noted that some proteins in our cells begin to denature at temperatures close to 43ºC, which is readily achievable in contracting muscle if care is not taken.
Heat stress is a normal part of exercise
At this point we have an appreciation that heat stress is a normal part of exercise and cannot be avoided. Ambient conditions also contribute to the heat stress associated with exercise. Moderate to elevated ambient conditions reduce the thermal gradient for radiating heat away from the surface of the body, thus exercise in warm or hot conditions results in a greater rate of body heat storage during exercise. High humidity has a similar effect on heat storage because the greater the humidity the smaller the water vapour pressure that allows for evaporation of sweat. Thus, under conditions of high humidity, very little sweat evaporates but rather may drip off in large amounts. This, in essence, is ‘wasted’ sweat because there is minimal associated evaporative cooling. The movement of air over the skin (convection) can be an effective cooling agent, particularly during prolonged exercise when ambient conditions are both cool and dry. When one is exercising at moderate intensity to high intensity and is wearing clothing or protective equipment, i.e. hockey players, the clothing effectively prevents or minimizes heat loss through evaporative cooling, radiation and convection – the rate of heat storage can exceed 1.5 times that without protective clothing (Noonan, 2006). If one is not careful, the rate and amount of heat storage can be too great, resulting in heat strain. The potential for heat strain is dependent on metabolic heat production, environmental conditions and apparel. (Table 9-3). In contrast, under cool conditions with low relative humidity and high air flow the resultant ‘wind chill’ creates a significant challenge to keep in the heat. In addition to these exercise and ambient influences on the body’s ability to regulate temperature, body temperature is also influenced by inflammation of injured tissues and by fever (illness). Thus, many factors can contribute to the heat stress that one experiences during periods of exercise. While heat stress is normal and, indeed, provides beneficial adaptations to occur over time (heat acclimatization), excessive heat stress will result in heat strain with risk of severe thermal injury.
|
|
Tennis |
Football |
Running |
Ice Hockey |
|---|---|---|---|---|
|
Body mass (kg)
|
70 |
95 |
65 |
75 |
|
V̇O2peak (L O2⋅min-1)
|
4.2 |
5.2 |
4.9 |
4.1 |
|
Exercise intensity (%V̇O2peak)
|
60 |
75 |
85 |
80 |
|
Metabolic heat production (W)
|
880 |
1330 |
1410 |
1380 |
|
Sweat evaporation required for heat balance (L⋅h-1)
|
1.3 |
2.0 |
2.1 |
1.8 |
|
Predicted steady state Tcore
|
38.4 |
39.2 |
39.7 |
39.5 |
|
Rise in Tcore without heat loss (ºC⋅h-1)
|
9.4 |
14.5 |
22.5 |
480 |
Sources: Brotherhood, 2008; Noonan, 2006; Noonan et al., 2007; Green et al., 1976; Montgomery, 2000; Palmer and Spriet, 2008; Palmer et al., 2010.
Physics, physiology, behavior, and the environment influence the ability to thermoregulate. These factors can be assessed in order to determine those conditions under which we will not be able to effectively thermoregulate. While the main indicator of heat stress is elevated core body temperature, other indicators may include increased heart rate, increased ventilation, increased blood flow to the skin (cutaneous vasodilation), and sweating. There is a continuum in these normal physiological responses as one approaches heat strain until one or more of the following indicators of heat strain (with impending injury) are reached: core temperature of 41ºC, heart rate continues to increase despite no increase in work load or power, increased frequency of breathing (panting), and sweat rate may decrease considerably (indicating profound dehydration). When indicators of heat strain occur, immediate steps should be taken to cool the person and try to restore hydration. Heat injury will occur when tissue temperature exceeds 43ºC (i.e. in contracting muscles), when the body has lost the ability to produce sweat and when dehydration is greater than 5% body weight. Thus, heat injury is often associated with hypotension (lower than normal blood pressure), nausea, and renal failure if dehydration and muscle injury are severe. It is therefore important to recognize and understand the signs of heat stress and heat strain in order to maintain health and to prevent injury.
Exercise Training and Heat Acclimatization
As one progresses from a sedentary or less active lifestyle, to a more active one (exercise training) there can occur a number of physiological adaptations that improve the interplay between muscle energetics, pulmonary gas exchange, and thermoregulation. From the perspective of thermoregulation, exercise is itself a cause of heat stress. The ability of the body to adapt to daily (or nearly so) repeated bouts of heat stress is termed heat acclimatization. Imposing additional heat stress to exercise, such as repeated bouts of exercise in warm or hot conditions, results in additional heat acclimatization responses beyond that seen with exercise training alone (Roberts et al., 1977). For example, with respect to sweat rate, exercise training results in a small decrease in the setpoint for sweating onset, and an increased slope of the esophageal temerature – sweating rate relationship, or enhanced sweating response for a given increase in esophageal temperature. With subsequent heat acclimatization there is minimal further increase in sweat rate at a given Tes, however there is a pronounced (up to 0.5 ºC) decrease in the hypothalamic thermal setpoint for onset of sweating.
Heat acclimatization results in decreased core temperature at rest, increased plasma volume, decreased heart rate during exercise, a decreased thermal setpoint for onset of sweating (thus earlier cutaneous vasodilation and onset of sweating = increased sweating sensitivity), increased sweat rate, and decreased sweat and urine sodium losses (Armstrong and Maresh, 1991). The increase in plasma volume occurs within 3-7 days and is beneficial to meet the demands of increased cardiac output during exercise in the heat. The full spectrum of complete adaptations requires at least 14 days of regular exercise.
Summary of Thermal Responses during Exercise
Evaporation of sweat is the predominant means for eliminating metabolic heat from the body during exercise. When there is a high temperature gradient between skin and the ambient air, then convective and radiative heat losses make a significant contribution, particularly when exercise is performed for prolonged periods of time. A practical caveat is when running or cycling against the wind, maintaining constant velocity requires increased expenditure of energy. As always, it is imperative that the athlete finds a good, operational balance between heat loss and metabolic energy expenditure during training and competition in order to avoid heat injury situations. Heat acclimation increases sweat rate and lower the thermal setpoint at which sweating is initiated. While heat acclimation confers many beneficial adaptations, it is very important to use effective strategies to replace fluids and maintain heat dissipation.
Acid-base Balance
In traditional terms, acid-base balance refers to regulation of the acidity of plasma and other body fluid compartments, as can be assessed from measures of the partial pressure of CO2 and pH. The relationship between these two variables and bicarbonate is provided by the Henderson-Hasselbalch equation:
pH = pK + log ( [HCO3–] / s PCO2 ) equation 9-3
where pK is the log of the dissociation constant (Kc) for the CO2 to [HCO3–] pseudo-equilibrium; and ‘s’ is the solubility coefficient for CO2 in aqueous solutions. The log transform can be removed to express the relationship in terms of [H+]:
Kc s PCO2 = [H+] [HCO3–] equation 9-4
This carbon dioxide view of acid-base balance is very limiting in terms of quantifying the factors that contribute to changes in acid-base state, because changes in the concentrations of many other substances contribute to changes in acid-base state.
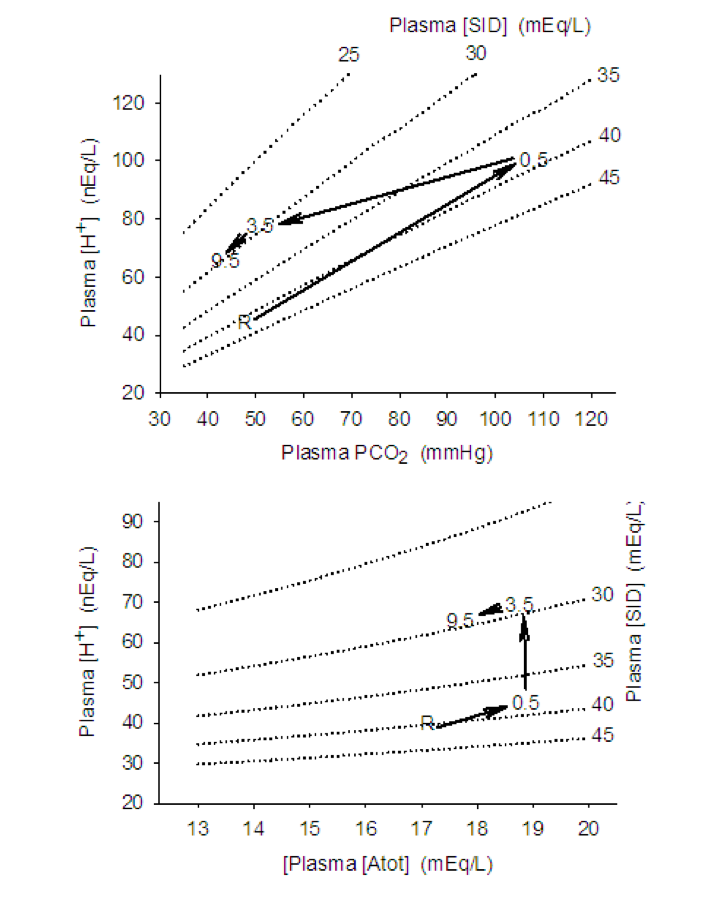
A more encompassing description of acid-base balance is provided by the physico-chemical approach described by Peter Stewart (1981; Lindinger and Heigenhauser, 2012). The approach recognizes that changes in the concentrations of strong and weak ions, as well as CO2, contribute to acid-base balance. Strong ions are those that are fully (or nearly so) dissociated in physiological solutions, and include Na+, K+, Ca2+, Mg2+, Cl–, and the metabolites lactate (lactate–) and phosphocreatine (PCr2-), which have dissociation constants of 1.9 and 3.9, respectively. The total concentration of weak ions (primarily proteins, some amino acids, and phosphate) is encompassed by the term [Atot]. The dependence of [H+] and [HCO3–] on the independent variables are shown in Figures 9-10, 9-11 and 9-12.
![This graph illustrates the dependence of plasma [H+] on total acid and strong ion difference. There are 5 lines on the graph, each one rising in plasma [H+] when plasma Atot increases from 13 to 20 mEq/L. When plasma SID is 25, [H+] increases from 70 to 95. When plama SID is 30, plasma [H+] increases from 50 to 65. When plasma SID is 35, plasma H+ increases from 40 to 50. When plasma SID is 40, plasma [H+] increases from 34 to 39. When plasma SID is 45, plasma [H+] increases from 30 to 34.](https://pressbooks.openeducationalberta.ca/app/uploads/sites/228/2022/10/9.10-Figure-300x229.png)
![This graph shows the effect of PCO2 on plasma [H+] at different levels of plasma SID. For a SID of 25, plasma [H+] increases from 76 to 125 as PCO2 changes from 35 to 70 mmHg. For a plasma SID of 30, plasma [H+] changes from 55 to 125 as PCO2 changes from 35 to 90 mmHg. For plasma SID of 35, plasma [H+] changes from 41 to 120 as PCO2 changes from 35 to 120 mmHg. For plasma SID of 40, plasma [H+] changes from 35 to 100 as PCO2 changes from 35 to 120 mmHg. For plasma SID 45, plasma [H+] changes from 25 to 85 as PCO2 changes from 35 to 120 mmHg.](https://pressbooks.openeducationalberta.ca/app/uploads/sites/228/2022/10/9.11-Figure-300x241.png)
![This figure shows the changes in [H+], bicarbonate and pH as SID changes from 36 to 54 mEq/L. [H+] decreases from 47 to 24 mEq/L, with evidence of buffering causing a bend in the curve (less decrease in [H+]. Bicarbonate increases in concentration from 25 to 40 mEq/L and pH increases from 7.34 to 7.6.](https://pressbooks.openeducationalberta.ca/app/uploads/sites/228/2022/10/9.12-Figure-1024x682.png)
The physico-chemical approach is capable of quantitatively assessing acid-base balance in a variety of normal and pathophysiological conditions. Physico-chemical characteristics refer to those properties and reactions that are physical and chemical in nature; they are capable of proceeding in the absence of enzymes and life, and occur as a result of the physical and chemical properties of the solvent and solute molecules (although they are facilitated in vivo by numerous enzymes). Accordingly, the physical and chemical mass action laws governing the reactions between molecules within aqueous solutions must be obeyed. These are:
- the law of conservation of mass (the mass of atoms is conserved as molecules undergo physical and biochemical reactions);
- there is a dynamic equilibrium state between water and weak electrolytes, as defined by their equilibrium constants; and
- the law of electroneutrality of solutions (any solution is comprised of molecules that in total have an equal number of positive and negative charges).
The maintenance of electroneutrality refers to the fact that aqueous solutions are always electrically neutral, that is, the sum of all negatively charged ion concentrations equals the sum of all positively charged ion concentrations:
– + [weak base cations] – [weak acid anions] + [H+] – [HO–] = 0 equation 9-5
From this equation we can separate out the contributions from strong ions. The difference between the sums of the concentrations of strong cations (positively charged) and anions (negatively charged) is termed the strong ion difference, or [SID], where the square brackets denote concentration units.
[SID] = – equation 9-6
The main weak ions in plasma is inorganic phosphate and the protein albumin. The total concentration of weak acids in solutions is denoted as [Atot].
With this background, we can see that the acid-base state of a solution can be described in terms of the PCO2, the [SID] and the [Atot]. The 5 equations describing mass action and one equation describing maintenance of electroneutrality are thus:
Water dissociation:
Kw = [H+] [–OH] equation 9-7a
Weak electrolyte system:
KA [HA] = [H+] [A–] equation 9-7b
[Atot] = [HA] + [A–] equation 9-7c
Carbon dioxide system:
Kc PCO2 = [H+] [HCO3–] equation 9-7d
K3 [HCO3–] = [H+] [CO32-] equation 9-7e
Electrical neutrality:
[SID] + [H+] – [HCO3–] – [A–] – [CO32-] – [–OH] = 0. equation 9-8
It is noteworthy that [H+] appears in each of these equations and its dependence on the concentrations of strong and weak acids/base and CO2 is evident. These six equations can be combined into a single equation that may then be solved for [H+]:
[H+]4 + {KA = [SID]} [H+]3 = {KA ([SID] – [Atot]) – (KC PCO2 + K’w)} . [H+]2 – {KA (KC PCO2 + K’w) + K3 KC PCO2} [H+] – KA K3 KC PCO2 = 0
Values for the constants depend on the solution being assessed and can be found in Lindinger and Heigenhauser, 2012. This equation, and variations of it, can be solved using available software (acidbase.org).
Acid-base Summary
The independent acid-base variables are [SID], [Atot], and PCO2.
The dependent acid-base variables are [H+], pH, [OH–], and [HCO3–].
The following are changes in independent variables that contribute to acidosis:
- decrease in [SID]; (decrease in [Na+], increase in [lactate–], increase in [Cl–])
- increase in [Atot]; (dehydration)
- increase in PCO2; hypoventilation
The following are changes in independent variables that contribute to alkalosis:
- increased in [SID]; (increase in [Na+], decrease in [lactate–], decrease in [Cl–])
- decrease in [Atot]; dilution of plasma – excessive fluid intake
- decrease in PCO2; hyperventilation
Disturbances to Acid-Base Balance: Prolonged Endurance Exercise
The ‘theoretical’ concepts of acid-base balance described above can be applied to any physiological situation, including exercise, as shown in Figure 9-13.
Using the example of the ultra-endurance exercise described above, our runner (BJ) lost 7 L of fluid through sweating and urine production and had replaced 4 L of this by drinking water. Analysis of a blood sample showed a mild acidosis that one may attribute to the fact that the person was exercising. This would be an error, however, as endurance exercise is seldom associated with a plasma acidosis because plasma [lactate] remains low, PCO2 normal, and [Atot] reflects the balance between sweating and water drinking.
Our runner had hyponatremia with a plasma [Na+] of 130 mmol · L-1, 10 mmol · L-1 lower than normal. Plasma [Cl–] would decrease too, but not as much (let’s say by 5 mmol · L-1) because of partial replacement from intracellular fluids. The result would therefore be a decrease in the [SID] of 5 mmolL-1, because changes in the concentrations of the other ions are very small and the positive and negative charges cancel out. The decrease in [SID] has an acidifying effect and therefore contributes to an increase in [H+] (decrease in pH). The effect of decreasing [SID] by 5 mmol · L-1 increased [H+] from a normal resting value of 40 mmol · L-1 (= 7.40) to 48.2 nmol · L-1 (pH = 7.32).
While drinking water also diluted plasma protein concentrations, the sweating-induced dehydration had resulted in increased plasma [protein]. Therefore, the water consumption would bring the increased plasma [Atot] close to normal. Thus, there would be minimal contribution of [Atot] to plasma acid-base balance.
The effects of the hyponatremia on ventilation, and therefore the plasma PCO2, are probably minor. Severe hypernatremia causes respiratory depression and affected individuals would thus under-ventilate, which would increase PCO2 which, in turn, would contribute to an increase in plasma [H+]. This runner’s ventilation was unaffected, and PCO2 was normal with therefore no contribution to the altered acid-base state.
In summary, with the water-drinking-induced hyponatremia, a decrease in plasma [Na+] of 10 mmol · L-1 and plasma [Cl–] of 5 mmol · L-1 contributed to a decrease in [SID] of 5 mmol · L-1. This decrease in [SID] increased plasma [H+] from 40 to 48 nmol · L-1 (decrease from 7.40 to 7.32). The mild acid-base disturbance could have been prevented by drinking a balanced electrolyte solution during the period of exercise.
Disturbances to Acid-Base Balance: Short Term, High Intensity Exercise
It is well known that short term, high intensity exercise results in an acidosis within contracting skeletal muscle and in blood. There is evidence that the acidosis, once thought to contribute to but does not, plays beneficial roles in maintaining muscle excitability and contractility during contraction in vivo (see Chapter 13). It is also widely believed, erroneously, that the accumulation of lactate within contracting muscle and in blood is a major contributor to the acidosis and to fatigue. In this section we will use the physico-chemical principles outlined above to show that the acidosis of exercise is multifactorial both in muscle and in blood (Figure 9-14).
For our example we will use a subject that is performing 30 seconds of a very high intensity leg bicycling exercise. The intensity is similar to what would be experienced with a 30 s sprint running uphill on a 15% slope. Energy for muscular ATP production is initially coming from the breakdown of PCr2– and, over the 30 s period, there are increasing contributions of glycolytic and also aerobic ATP production. As stated above, PCr2– is considered a strong acid anion in muscle so its hydrolysis results in a decrease in [PCr2-] and hence contributes to a increase in muscle [SID] and therefore a decrease in muscle [H+] (i.e. an alkalinizing effect). This reflects what has been measured in muscle during the first 10-15 s of high intensity exercise.
Changes in Independent Variables and [H+] Within Contracting Muscle
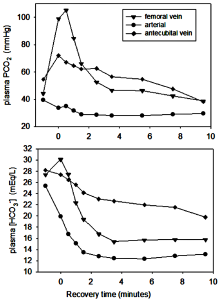
In order to determine changes occurring within muscle during 30 s of high intensity exercise a muscle biopsy and blood samples from the femoral and radial arterial were obtained within the first 30 s of recovery (Kowalchuk et al., 1988a; 1988b). Muscle [SID] decreased by 50 mmol · L-1 due mainly to the increase in [lactate–] and decrease in [K+] (Figure 9-15, Table 9-4); the decrease in [SID] directly contributed 61% to the increase in [H+]. A measured femoral venous plasma PCO2 of 96 mm Hg indicates that muscle PCO2 was at least 100 mm Hg; this contributed 13% to the increase in [H+]. Muscle [Atot] also increased due to the accumulation of weak acid metabolites; it can be calculated that the increase in [Atot] directly contributed 26% to the increase in muscle [H+]. Thus, the increase in muscle [lactate–] contributed not more than 50% to the muscle acidosis of high intensity exercise.
![There are three graphs in this sequence, each describing some aspect of acid-base balance during and following an intense 30 s bout of exercise. in the first graph, muscle [H+] is plotted against PCO2. At rest, pH is about 100 nequ/L and PCO2 is about 60 mmHg. At the end of the 30 s exercise, Muscle [H+] has increased to about 300 nequ/L and PCO2 is 100 mm Hg. During recovery, muscle [H+] continues to increase to 400 by 3.5 min, but PCO2 falls to 60 in this time. After 9.5 min of recovery, [H+] is 345 and PCO2 is 40 mmHg. Isopleths showing constant SID go from 378 to 400 nEq/L [H+] with changes in PCO2 from 40 to 100 mmHg.In the second graph, muscle [H+] is plotted against total muscle acids or muscle Atot. Both of these increase during the exercise, but total acids decrease in the first 30 s of recovery while muscle [H+] continues to increase until 3.5 min. Then both decrease along the isopleth for 80 SID. The third graph shows muscle [H+] vs Muscle SIDAt rest, SID is about 100 mEq/L and after 30 s of intense exercise it is 62 at which time muscle [H+] is 325. Muscle H+ continues to rise as Atot recovers a little, then muscle [H+] falls with another small change in muscle SID.](https://pressbooks.openeducationalberta.ca/app/uploads/sites/228/2022/10/9.15-Figure-483x1024.png)
|
Dependent variables |
Arterial plasma |
Skeletal muscle |
||
|---|---|---|---|---|
|
|
rest |
exercise |
rest |
exercise |
|
[H+] nanoEq · L-1
|
40 |
49 |
100 |
170 |
|
pH
|
7.40 |
7.31 |
7.0 |
6.77 |
|
[HCO3–] mEq · L-1 |
28 |
19 |
10 |
3 |
|
|
||||
|
Independent variables |
rest |
exercise |
rest |
exercise |
|
|
40 |
37 |
45 |
110 |
|
[SID] mEq · L-1
|
40 |
35 |
110 |
60 |
|
[Atot] mEq · L-1
|
12 |
15 |
140 |
170 |
|
Strong Ions
|
|
|
|
|
|
[Na+] mEq ·L-1
|
140 |
146 |
15 |
40 |
|
[K+] mEq · L-1
|
3.7 |
5.5 |
140 |
110 |
|
[Cl–] mEq · L-1
|
105 |
110 |
10 |
20 |
|
[lactate–] mEq · L-1
|
1.0 |
10 |
1.5 |
45 |
|
[PCr2-] mEq · L-1
|
na |
na |
15 |
5 |
Source: Data from Lindinger & Heigenhauser, 2012; Stickland et al., 2012.
Changes in Independent Variables and [H+] Within Arterial Plasma
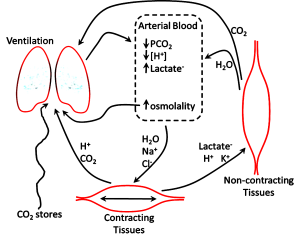
Arterial plasma is a reflection of numerous ion, metabolite, and gas exchange processes that occur between extracellular fluids and cells, including those of the lungs and non-contracting tissues (Figure 9-16). Arterial plasma thus has a very different composition than that of venous plasma, draining contracting skeletal muscle and draining non-contracting tissues (Figure 9-17). Arterial plasma thus has a different acid-base state than that of femoral venous plasma and antecubital venous plasma. Because arterial blood is blood that has returned from the lungs and not yet perfused tissues, it has been re-oxygenated and important for acid-base regulation, the CO2 has been removed. The PCO2 of arterial plasma is typically lower with high intensity exercise than at rest due to the hyperventilation of exercise; this demonstrates how well the lungs eliminate excess CO2 arising from high rates of aerobic production within contracting muscles. The lower PCO2 at the end of 30 s of very high intensity exercise contributed 4 nmol·L-1 to a lowering of [H+]. In this example, arterial plasma [lactate–] is 10 mmol·L-1, less than in femoral venous plasma (13 mmol·L-1) due to diffusion of lactate– into red blood cells and other tissues. The simultaneous changes in plasma strong ion concentrations results in a [SID] that is decreased by 5 mmol·L-1, which contributed 8 nmol·L-1 to the increase in [H+]. An osmotic fluid shift from plasma into contracting muscle results in an increase in plasma [Atot], which contribute 5 nmol·L-1 to the increase in [H+]. The net effect of CO2 (- 4 nmol·L-1), [SID] (+8 nmol·L-1) and [Atot] (+5 nmol·L-1) was 9 nmol·L-1.
Summary
We used examples of prolonged, low intensity exercise and of short-term high intensity exercise to show that the factors contributing to acid-base state are multifactorial. We also showed that the contributions from each of the independent acid-base variables can be determined, and that the contributions differ depending on the intensity and duration of exercise. With prolonged, low intensity exercise, dehydration and excessive water ingestion result in altered plasma water and electrolyte balance, and hence acid-base balance. The fluids ingested prior to, during, and after exercise of this type should be balanced fluids with respect to water and electrolyte contents. This will not only reduce acid-base disturbances, but facilitate maintenance of hydration and thermoregulation. With short-term high intensity exercise the increase in muscle and plasma [lactate–] contributed at best to about 50% of the acidosis. The muscle acidosis of exercise also has important contributions from decreased muscle [K+], increased PCO2 and increased [Atot]. The arterial plasma acidosis of exercise has its main contributions from decreased [SID] associated with increased [lactate–] and from increased [Atot].
Exercises or Topics for Discussion
- Read the labels for four different electrolyte products (from the store or from websites) and tabulate the concentrations of ingredients so that you can easily compare the composition of the different products.
- Which product would you use and recommend as the most effective product to replace fluid (water and electrolyte) losses due to sweating?
- Provide a few good reasons for your answer.
- For each, water and Gatorade, estimate the plasma ion concentrations after 4 hours of exercise using the parameters provided in the case presentation. Refer to Table 9.1 to guide you in your calculations.
- How would running in the rain influence BJ’s ability to dissipate heat when running for an hour in warm conditions?
- In the first scenario describing BJ running for 4 hours and drinking only water, describe the effect of combined sweating and drinking water on plasma [Atot] and [SID]. Based on the change in each of these two independent variables, state the direction of change in [H+] and [HCO3–].
References
Adams WC, Mack GW, Langhans GW, and Nadel ER. 1992. Effects of varied air velocity on sweating and evaporative rates during exercise. Journal of Applied Physiology 73(6):2668-2674.
Armstrong LE and Maresh CM. 1991. The induction and decay of heat acclimatisation in trained athletes. Sports Medicine 12:302-12.
Baker LB, Stofan JR, Lukaski HC, and Horswill CA. 2011. Exercise-induced trace mineral element concentration in regional versus whole-body wash-down sweat. International Journal of Sport Nutrition & Exercise Metabolism 21(3):233-9.
Baker LB and Jeukendrup AE. 2014. Optimal composition of fluid-replacement beverages. Comprehensive Physiology 4(2):575-620. doi: 10.1002/cphy.c130014.
Brengelmann GL, Johnson JM, Hermansen L, and Rowell LB. 1977. Altered control of skin blood flow during exercise at high internal temperature. Journal of Applied Physiology: Respiratory, Environmental and Exercise Physiology 43(5):790-794.
Brotherhood JR. 2008. Heat stress and strain in exercise and sport. Journal of Science and Medicine in Sport 11(1):6-19.
Cain JB, Livingstone SD, Nolan RW, and Keefe AA. 1990. Respiratory heat loss during work at various ambient temperatures. Respiration Physiology 79(2):145-50.
Coyle, E..F. Sidossis, L.S., Horowitz,J.F. and Beltz, J.D. 1992. Cycling efficiency is related to percentages of Type I uscle fibers. Med. Sci. Sports and Exerc. 24: 782-0788.
Ely MR, Kenefick RW, Cheuvront SN, Chinevere T, Lacher CP, Lukaski HC, and Montain SJ. 2013 . The effect of heat acclimation on sweat microminerals: artifact of surface contamination. International Journal of Sport Nutrition & Exercise Metabolism 23(5):470-9.
Green H, Bishop P, Houston M, McKillop R, Norman R, and Stothart P. 1976. Time-motion and physiological assessments of ice hockey performance. Journal of Applied Physiology 40:159-163.
Jarmuszkiewicz W, Woyda-Ploszczyca A, Koziel A, Majerczak J, and Zoladz JA. 2015. Temperature controls phosphorylation and reactive oxygen species production through uncoupling in rat skeletal muscle mitochondria. Free Radical Biology and Medicine 83:12-20. doi: 10.1016/j.freeradbiomed.2015.02.012
Johnson JM, O’Leary DS, Taylor WF, and Park MK. 1984. Reflex regulation of sweat rate by skin temperature in exercising humans. Journal of Applied Physiology: Respiratory, Environmental and Exercise Physiology 56(5):1283-1288.
Kenny GP, Reardon FD, Zaleski W, Reardon ML, Haman F, and Ducharme MB. 2003. Muscle temperature transients before, during, and after exercise measured using an intramuscular multisensor probe. Journal of Applied Physiology (1985) 94(6):2350-7.
Kenney WL, Stanhewicz AE, Bruning RS, and Alexander LM. 2014. Blood pressure regulation III: what happens when one system must serve two masters: temperature and pressure regulation? European Journal of Applied Physiology 114(3):467–479. doi: 10.1007/s00421-013-2652-5.
Kowalchuk JM, Heigenhauser GJ, Lindinger MI, Sutton JR, and Jones NL. 1988a. Factors influencing hydrogen ion concentration in muscle after intense exercise. Journal of Applied Physiology 65:2080-2089.
Kowalchuk JM, Heigenhauser GJ, Lindinger MI, Obminski G, Sutton JR, and Jones NL. 1988b. Role of lungs and inactive muscle in acid-base control after maximal exercise. Journal of Applied Physiology 65:2090-2096.
Lara B, Gallo-Salazar C, Puente C, Areces F, Salinero JJ, and Del Coso J. 2016. Interindividual variability in sweat electrolyte concentration in marathoners. Journal of the International Society of Sports Nutrition 29(13):31. doi: 10.1186/s12970-016-0141-z.
Lindinger MI and Heigenhauser GJF. 2012. Effects of gas exchange on acid-base balance. Comprehensive Physiology 2:1-52.
Maughan RJ, Owen JH, Shirreffs SM, and Leiper JB. 1994. Post-exercise rehydration in man: effects of electrolyte addition to ingested fluids. European Journal of Applied Physiology and Occupational Physiology 69(3):209-15.
Montgomery DL. 2000. Physiology of ice hockey. In Exercise and sport science. W. Garrett, Kirkendall, DR, editor. Philadelphia, PA: Lippincott Williams & Wilkins. 815-828.
Nadel ER, Bullard RW, and Stolwijk JA. 1971. Importance of skin temperature in the regulation of sweating. Journal of Applied Physiology 31(1):80-7.
Noonan B. 2006. The physiological effects of hockey protective equipment on high intensity intermittent exercise. Yale Medicine Thesis Digital Library. 276. http://elischolar.library.yale.edu/ymtdl/276
Noonan B, Mack G, and Stachenfeld N. 2007. The effects of hockey protective equipment on high-intensity intermittent exercise. Medicine & Science in Sports & Exercise 39(8):1327-35.
Otani H, Kaya M, Tamaki A, Watson P, and Maughan RJ. 2018. Air velocity influences thermoregulation and endurance exercise capacity in the heat. Applied Physiology, Nutrition, and Metabolism 43(2):131-138. doi: 10.1139/apnm-2017-0448.
Palmer MS, Logan HM, and Spriet LL. 2010. On-ice sweat rate, voluntary fluid intake, and sodium balance during practice in male junior ice hockey players drinking water or a carbohydrate-electrolyte solution. Applied Physiology, Nutrition, and Metabolism 35(3):328-35.
Palmer MS and Spriet LL. 2008. Sweat rate, salt loss, and fluid intake during an intense on-ice practice in elite Canadian male junior hockey players. Applied Physiology, Nutrition, and Metabolism 33(2):263-71.
Proactive Nutrition 2018. Sports drinks: What’s in your bottle?? http://www.proactivenutrition.net/2011/04/19/sports-drinks-whats-in-your-bottle/
Robergs RA. 1998. Glycerol hyperhydration to beat the heat? http://www.sportsci.org/traintech/glycerol/rar.htm (access May 19, 2012)
Roberts MF, Wenger CB, Stol- Wijk JAJ, and Nadel ER. 1977. Skin blood flow and sweating changes following exercise training and heat acclimation. Journal of Applied Physiology: Respiratory, Environmental and Exercise Physiology 43(1):133-137.
Sawka MN, Cheuvront SN, and Carter R 3rd. 2005. Human water needs. Nutrition Reviews 63(6 Pt 2):S30-9.
Shirreffs SM, Casa DJ, and Carter R 3rd. 2007. Fluid needs for training and competition in athletics. International Association of Athletics Federations. Journal of Sports Sciences 25 Suppl 1:S83-91. Erratum In: Journal of Sports Sciences. 2009. 27(6):667.
Siegel Aj, Januzzi J, Sluss P, Lee-Lewandrowski E, Wood M, Shirey T, and Lewandrowski Kb. 2008. Cardiac Biomarkers, Electrolytes, And Other Analytes In Collapsed Marathon Runners: Implications For The Evaluation Of Runners Following Competition. American Journal of Clinical Pathology 129(6):948-51.
Stewart P. 1981. How To Understand Acid-Base: A Quantitative Acid-Base Primer for Biology and Medicine. New York: Elsevier/North-Holland,.
Stickland MK, Lindinger MI, Olfert IM, Heigenhauser GJ, and Hopkins SR. 2013. Pulmonary Gas Exchange and Acid-Base Balance during Exercise. Comprehensive Physiology 3(2):693-739. doi: 10.1002/cphy.c110048.
Tikuisis P, Meunier P, and Jubenville CE. 2001. Human body surface area: measurement and prediction using three dimensional body scans. European Journal of Applied Physiology 85(3-4):264-71.
White MD. 2006. Components and mechanisms of thermal hyperpnea. Journal of Applied Physiology 101(2):655-63.
About The Author
Michael I. Lindinger, PhD, President, The Nutraceutical Alliance

Michael Lindinger is classically educated in comparative animal physiology and has strong research interests in exercise physiology (Jones, Heigenhauser, Sutton group at McMaster University), skeletal muscle physiology with focus on water and electrolyte balance, muscle biochemistry and whole body fluid balance, hydration and thermoregulation. More recent interests include the effects of nutraceutical ingredients on joint health and muscle performance. After a 25-year career as a professor at the University of Guelph he left in 2013 to own and operate an equine research farm and The Nutraceutical Alliance with Dr. Wendy Pearson. He currently owns and is president of The Nutraceutical Alliance in which role he helps clients design effective, science-based nutraceutical supplements, and designs and implements research projects. He continues to be active in research and publishing. He presently serves on the editorial board of several scientific journals including the European Journal of Applied Physiology, Scientifica Physiology, and Animals.

.jpg)